
How to Audit 100 Trades and Find Weaknesses
I sat staring at my trading dashboard, watching another promising setup disintegrate into a stop-loss hit. It was not a catastrophic loss, but it was part of a slow, steady hemorrhage that had been draining my capital for three straight months. I was doing everything the trading books told me to do: drawing key support and resistance levels, tracking market news, and managing position sizing. Yet, my equity curve looked like a ski slope.
That evening, I stopped placing orders. I realized that continuously switching indicators or hopping to new trading platforms without analyzing my past behavior was pure gamble. I needed hard data. I decided to isolate my last 100 executed trades, put them under a metaphorical microscope, and execute a complete account audit.
What I discovered during that process transformed my trading performance forever. It revealed that my strategy was not the main issue; my execution blind spots, timing errors, and hidden psychological habits were quietly sabotaging every gain. Here is the exact framework I used to audit 100 trades, pinpoint my structural weakness.
Why 100 Trades Is the Magic Baseline
When traders try to evaluate performance based on 5 or 10 trades, they fall prey to sample size bias. A winning streak over 10 trades can make a flawed system look brilliant due to market variance. Conversely, a 5-trade losing streak can make a statistical edge look broken.
Evaluating 100 consecutive trades offers a reliable sample size. It balances statistical significance with manageable review effort:
- Statistical Significance: 100 trades smooth out market noise, revealing your true mathematical win rate and expectancy.
- Behavioral Patterns: Bad habits like revenge trading or moving stop-losses happen repeatedly. A 100-trade log exposes these structural patterns clearly.
- Contextual Diversity: 100 trades generally span multiple market cycles, including trending, ranging, and high-volatility conditions.
If you trade on fast-paced venues like IQ Option or utilize specialized execution platforms like Pocket Option, accumulating 100 trades happens faster than you think. However, logging them requires absolute discipline.
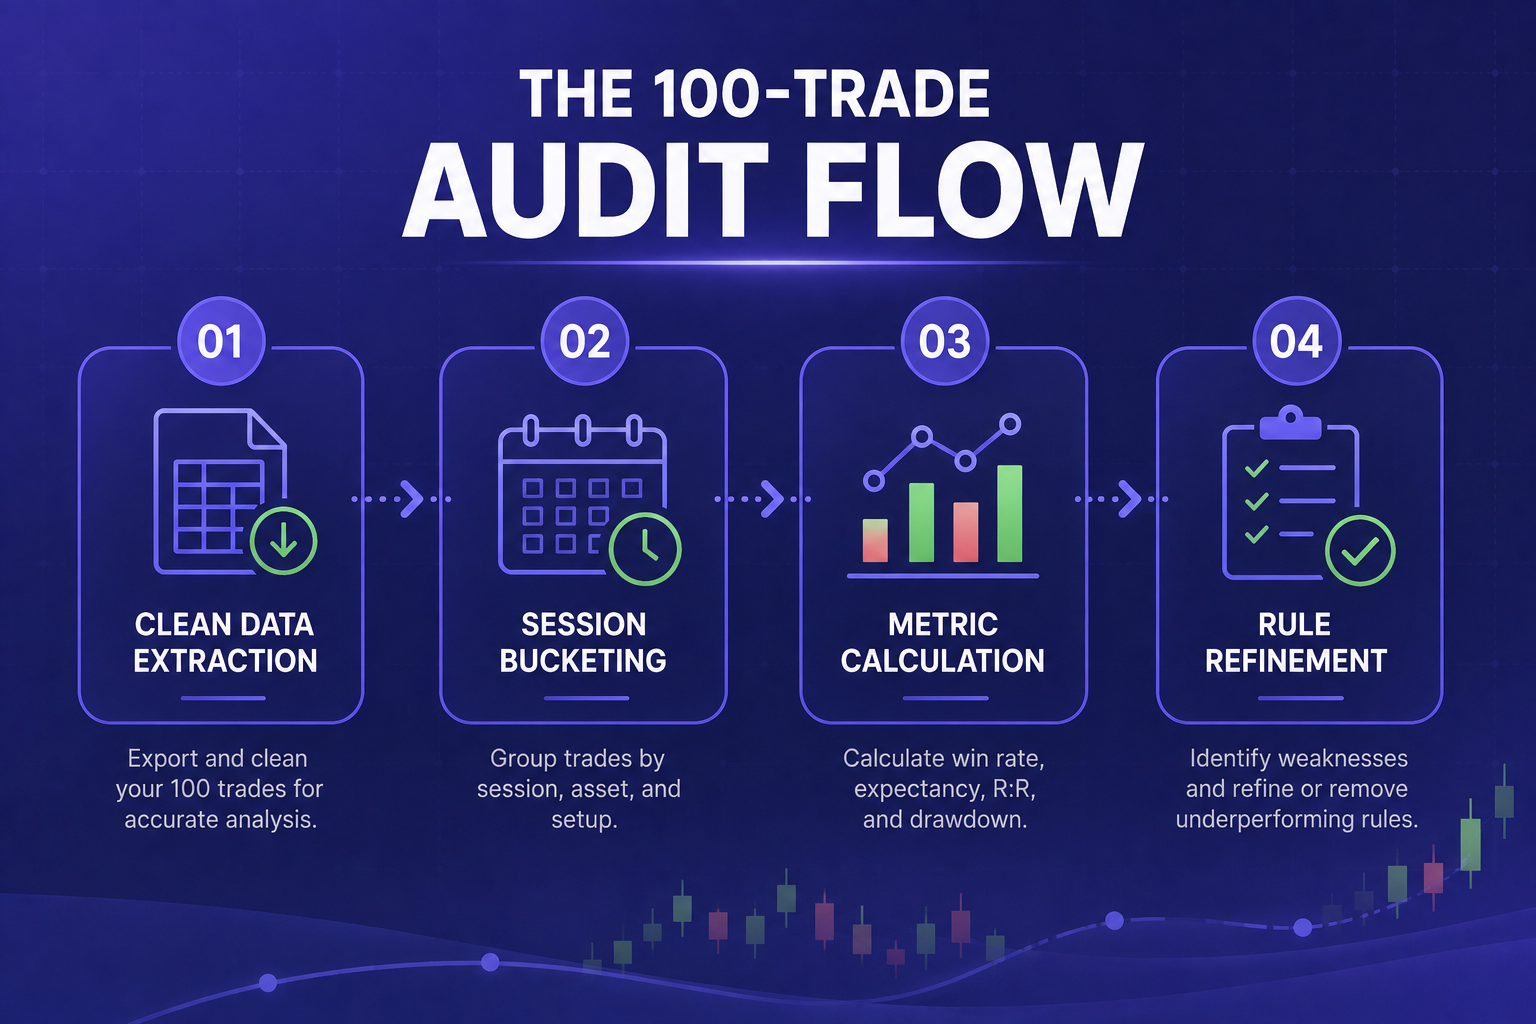
Phase 1: Structuring Your Audit Data Log
Before analyzing performance, I needed to gather clean data. Standard broker statements list entry price, exit price, and net profit or loss, but they lack essential contextual information. I exported my history into a custom tracking sheet containing several key parameters:
- Market Mechanics: Asset name, trade direction (Long/Short), leverage, and position size.
- Temporal Data: Exact timestamp of entry and exit, including day of the week and trading session (Asian, London, NY).
- Execution Quality: Planned Risk-to-Reward (R:R) versus Realized R:R.
- Emotional Context: Personal state before placing the trade (Calm, Anxious, Impulsive, Bored).
- Rule Adherence: Did the setup strictly meet my written checklist criteria? (Yes/No).
If you are executing quick short-term setups across brokers like Binomo or navigating forex volatility on platforms like ExpertOption, recording emotional context at the exact moment of trade entry is critical.
Phase 2: Running the 4-Step Weakness Diagnostic
Once my 100 trades were organized in the log, I stopped viewing the outcomes in terms of dollars and cents. I converted everything into R-multiples (where 1R equals initial risk). If I risked $50 to make $150, a win equaled +3R, and a loss equaled -1R.
This dollar-neutral approach removed emotional bias from the numbers. I then ran my data through four diagnostic checks:
Diagnostic 1: Expectancy by Time and Session
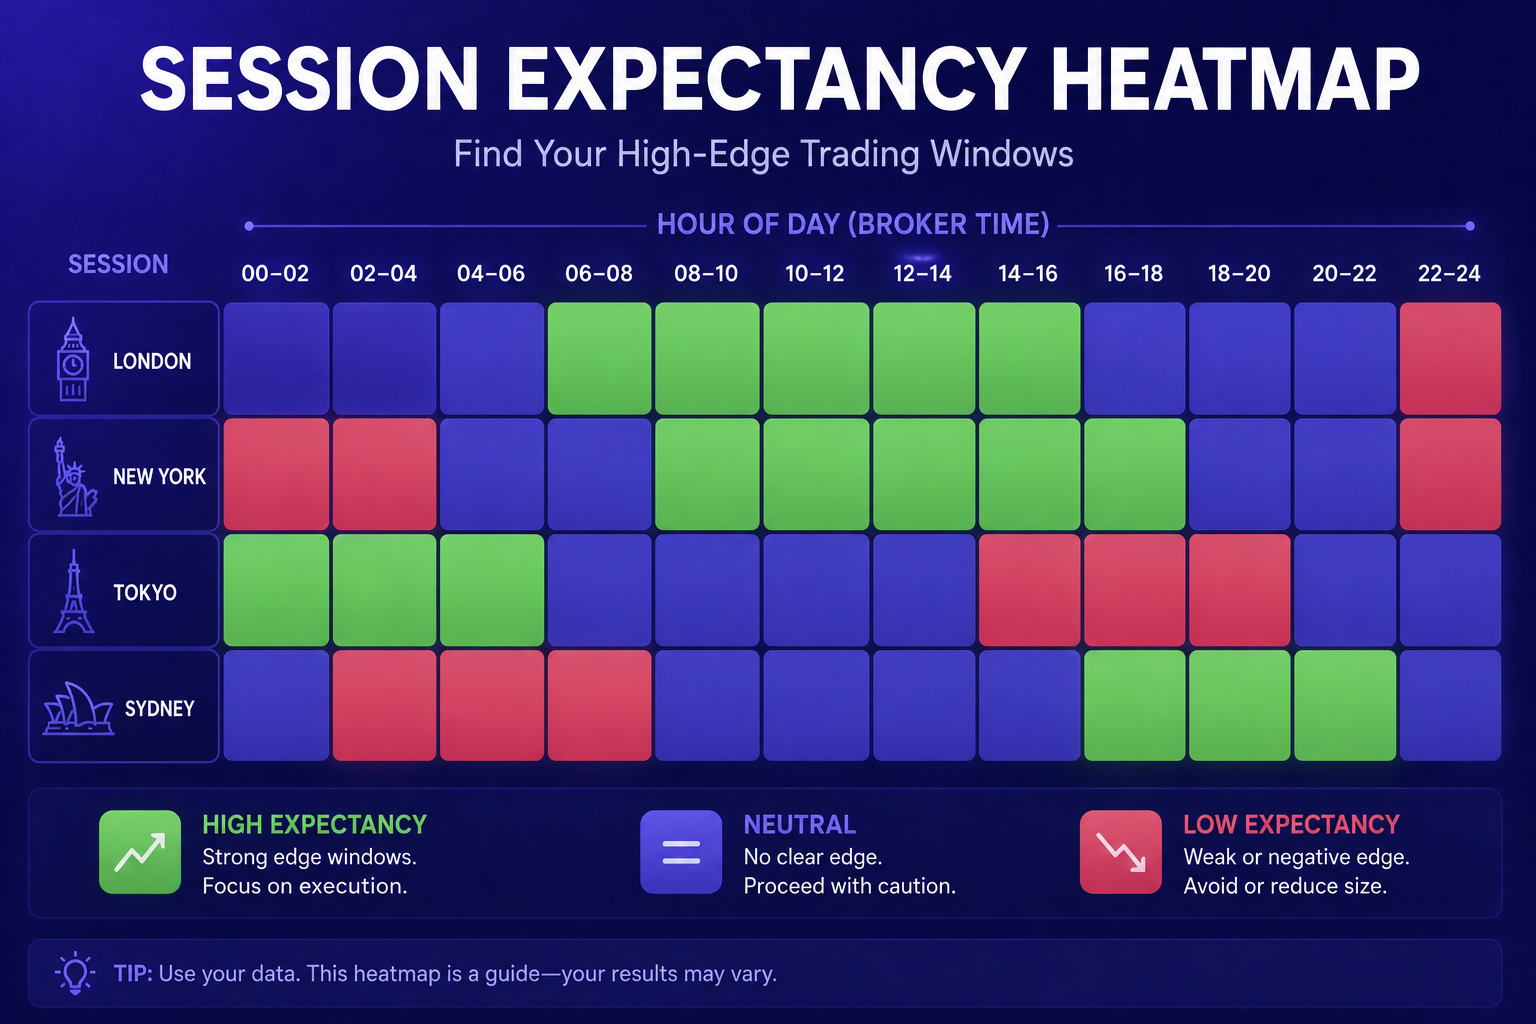
I mapped all 100 trades across hourly buckets and session windows. The data revealed an alarming pattern:
- London Session (08:00 - 12:00 UTC): Win rate of 62%, Expectancy of +1.4R per trade.
- New York Session (13:00 - 17:00 UTC): Win rate of 55%, Expectancy of +0.8R per trade.
- Asian Session (23:00 - 05:00 UTC): Win rate of 28%, Expectancy of -0.9R per trade.
I was giving back nearly all my daytime profits by taking low-liquidity setups at night while suffering from mental fatigue. The lesson was immediate: stop trading during the Asian session entirely.
Diagnostic 2: Setup and Asset Class Segmentation
Next, I isolated performance by asset class and chart patterns. I realized I had strong execution metrics on crypto trends, but kept losing capital trying to trade reversal setups on equities via platforms likeCapitalCore andQuotex.
By analyzing asset performance, I cut two underperforming patterns out of my strategy, instantly raising my baseline win rate.
Diagnostic 3: Planned R:R vs. Realized R:R (The Leak Metric)
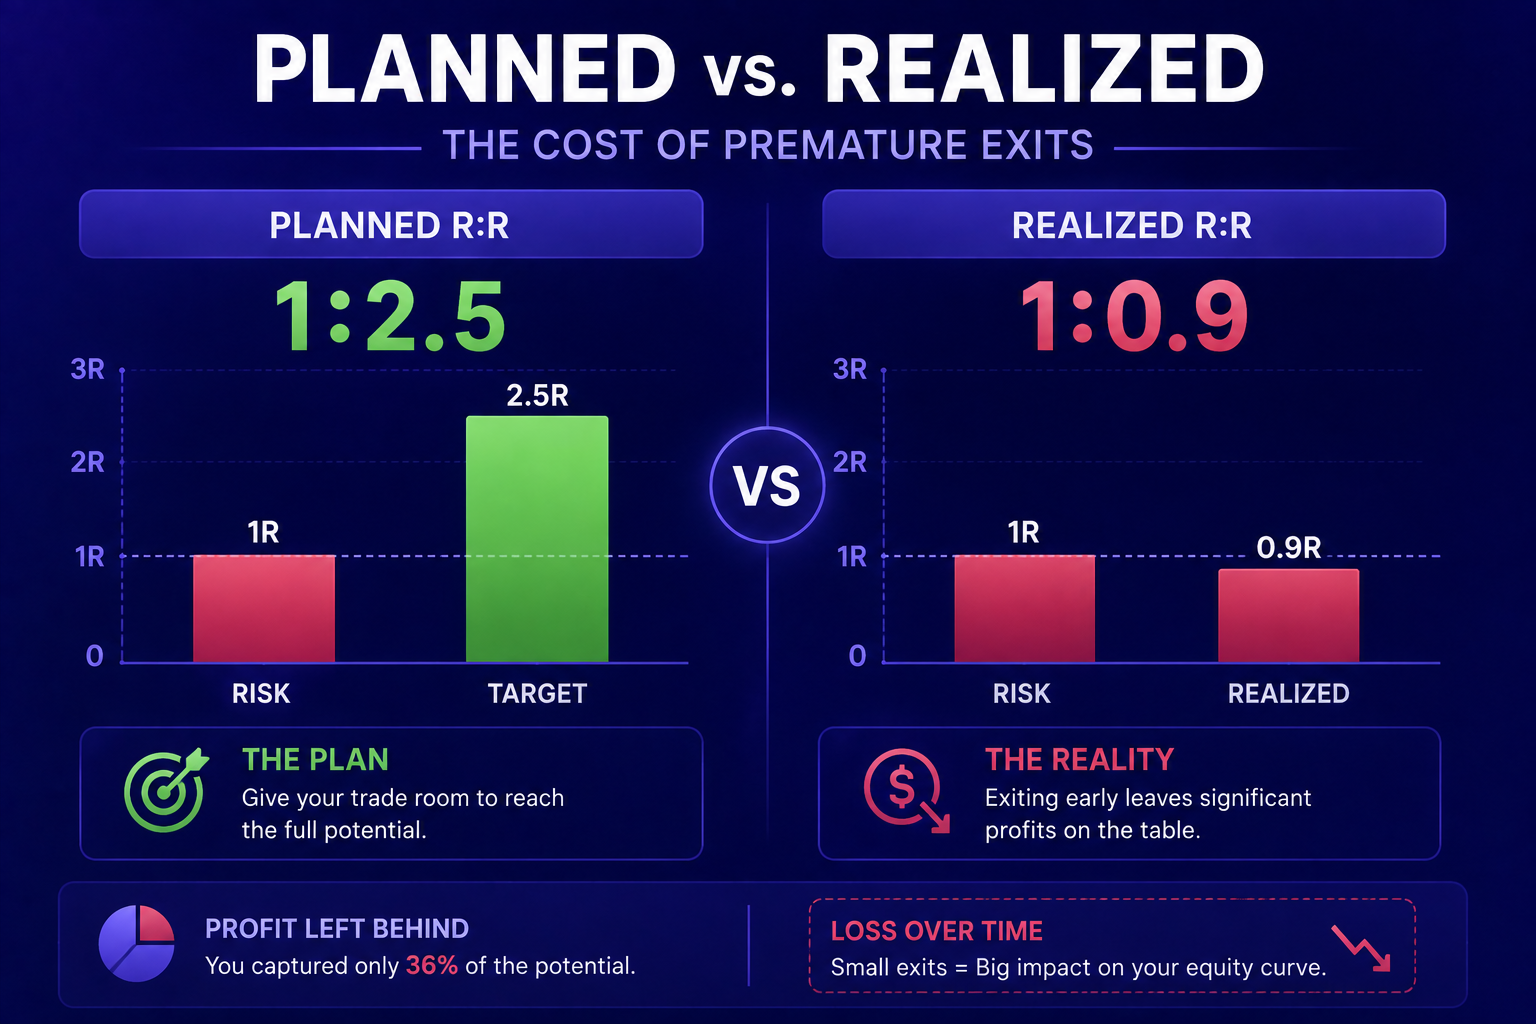
This metric uncovered my biggest flaw. On paper, my trading strategy had an average planned Risk-to-Reward ratio of 1:2.5. However, my realized R:R across the 100 trades was a disappointing 1:0.9.
Why the massive discrepancy?
- I was closing winning positions early due to anxiety about losing open profit.
- I was letting losing positions hover past my stop-loss levels, hoping for a bounce.
I was cutting my winners short and letting my losses stretch out. To clean up your chart analysis and prevent emotional exits, review our detailed guide on Price Action vs Indicators to refine your technical confirmation parameters.
Diagnostic 4: The Rule Breach Tax
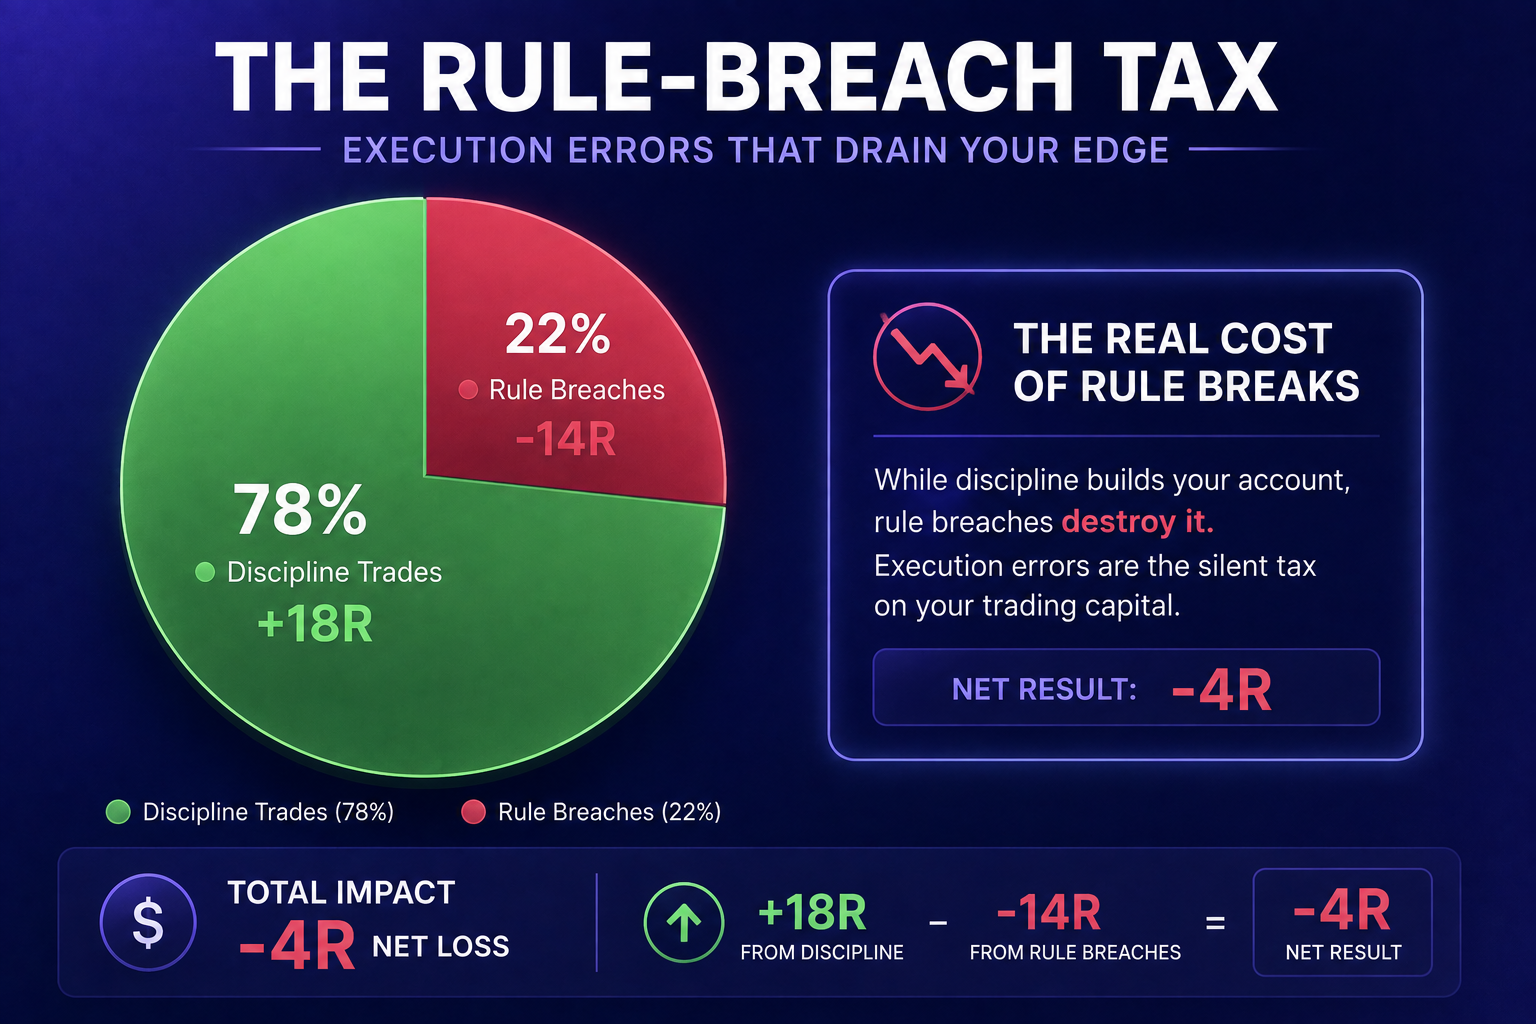
I added up the financial impact of every trade marked as a rule breach (impulse trades, premature entries, revenge trades). Out of 100 trades, 22 breached my written strategy guidelines.
Those 22 invalid trades accounted for 80% of my total account drawdowns. My system was actually profitable; my personal lack of execution discipline was what kept breaking it.
Phase 3: Converting Audit Insights into Concrete Rules
Data is useless without structural action. Once my 100-trade audit uncovered my exact account leaks, I wrote three non-negotiable execution rules into my daily trading protocol:
- Strict Operational Windows: I restricted all order execution to the London and New York sessions. Off-hours trading was banned.
- Automated Trade Management: Once an order was placed on platforms like Olymp Trade, I was forbidden from adjusting stop-loss or take-profit orders manually. The trade had to hit the target or the stop organically.
- The 2-Loss Daily Circuit Breaker: If I took two consecutive losses, I locked my terminal for the rest of the day to eliminate emotional revenge trading.
To understand how to read market structure cleanly and avoid entering low-probability trades during volatile conditions, check out our walkthrough on Bitcoin Range Analysis: How to Read Highs, Lows and Mid-Range.
The Results: My Next 100 Trades
The impact of applying these audit insights was immediate. Over my next 100 logged trades:
- My overall win rate increased modestly from 44% to 53%.
- My realized R:R ratio doubled from 1:0.9 to 1:1.8 because I stopped cutting winning trades short.
- My maximum drawdown dropped by 65% simply because I eliminated off-hours trading and impulse trades.
I didn't need a complex new indicator or a top-secret strategy. I simply needed to audit my performance, analyze my execution weaknesses, and align my habits with data.
If you trade day trading or short-term assets, mastering high-probability chart patterns is critical. Learn how to structure setups with precision by reading our guide to Master the Triangle Breakout in Binary Trading.
Take Your Trading Edge to the Next Level
Auditing your trades gives you clarity on where your account is leaking capital, but combining disciplined execution with institution-grade market insights is what truly elevates a trader's performance.
If you are ready to stop guessing and start trading with actionable data, gain access to live AI market forecasts, high-probability decision zones, and comprehensive multi-asset analytics across crypto, forex, and stock markets.
Visit the BeCoin Forecast Hub to explore real-time technical signals, or upgrade your market edge today by selecting a plan at BeCoin Premium Tariffs.

Simple Daily Trading Routine for Consistency
Most traders do not fail because of strategy alone. They fail because they are random. They trade when emotional, skip planning, increase risk after losses, and ignore review sessions. Consistency in trading usually comes from routine more than prediction. A simple daily trading routine helps you stay disciplined, reduce emotional mistakes, and improve decision making […]
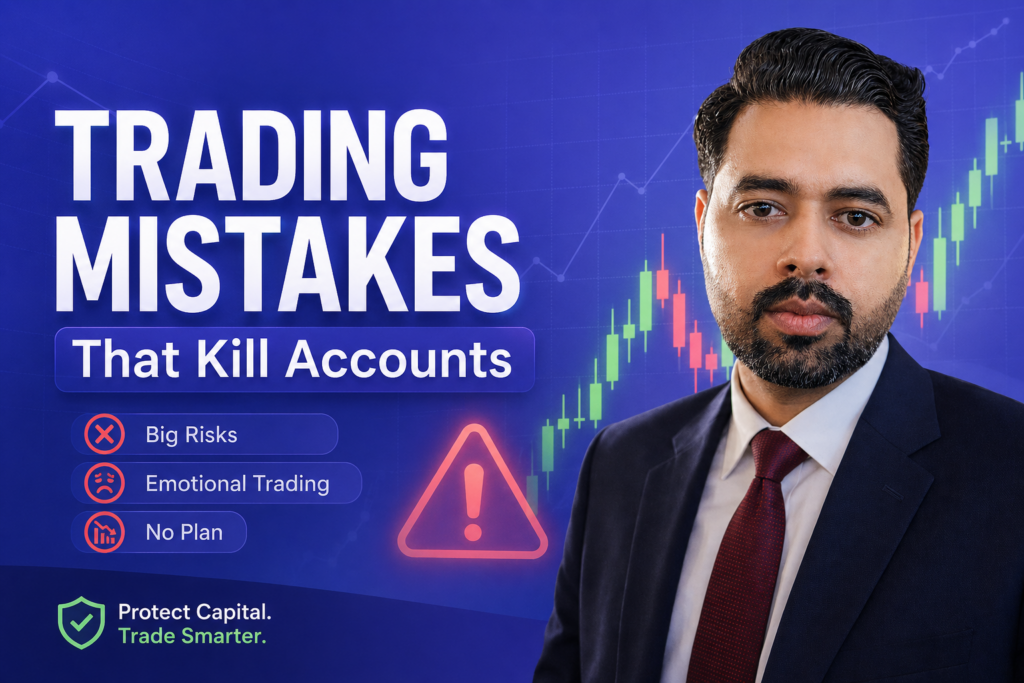
Biggest Beginner Mistakes That Kill Trading Accounts
Trading looks simple from the outside. Open an account, place a few trades, and grow your balance. But reality is different. Most beginners do not lose because markets are impossible. They lose because they repeat the same avoidable mistakes. A small account can survive bad market conditions. What usually kills it is poor decision-making, emotional […]

Safest Trading Platforms (Risk Breakdown) – Real Comparison for 2026
Choosing a trading platform isn’t about features — it’s about avoiding hidden risk. Most traders compare brokers like Quotex vs Pocket Option vs Deriv vs Olymp Trade expecting a clear winner. Instead, they find conflicting reviews, promotional claims, and no real explanation of how these platforms behave when money is on the line. The real […]

Deriv vs IQ Option for Beginners in 2026: Which Platform Is Better to Start With?
Choosing your first trading platform can decide whether you stay consistent or quit after blowing your first account. Most beginners do not fail because trading is impossible. They fail because they start on platforms that confuse them, encourage emotional trading, or make risk management difficult. Two names that often appear in beginner discussions are Deriv […]

Which Is Easier for Beginners: Binomo or IQ Option?
For most beginners, the hardest part of trading is not strategy. It is surviving the first few months without blowing the account from emotional decisions, overtrading, and poor risk management. That is why choosing the right platform matters more than many new traders realize. Two names dominate beginner conversations in binary and short-term trading: Binomo […]