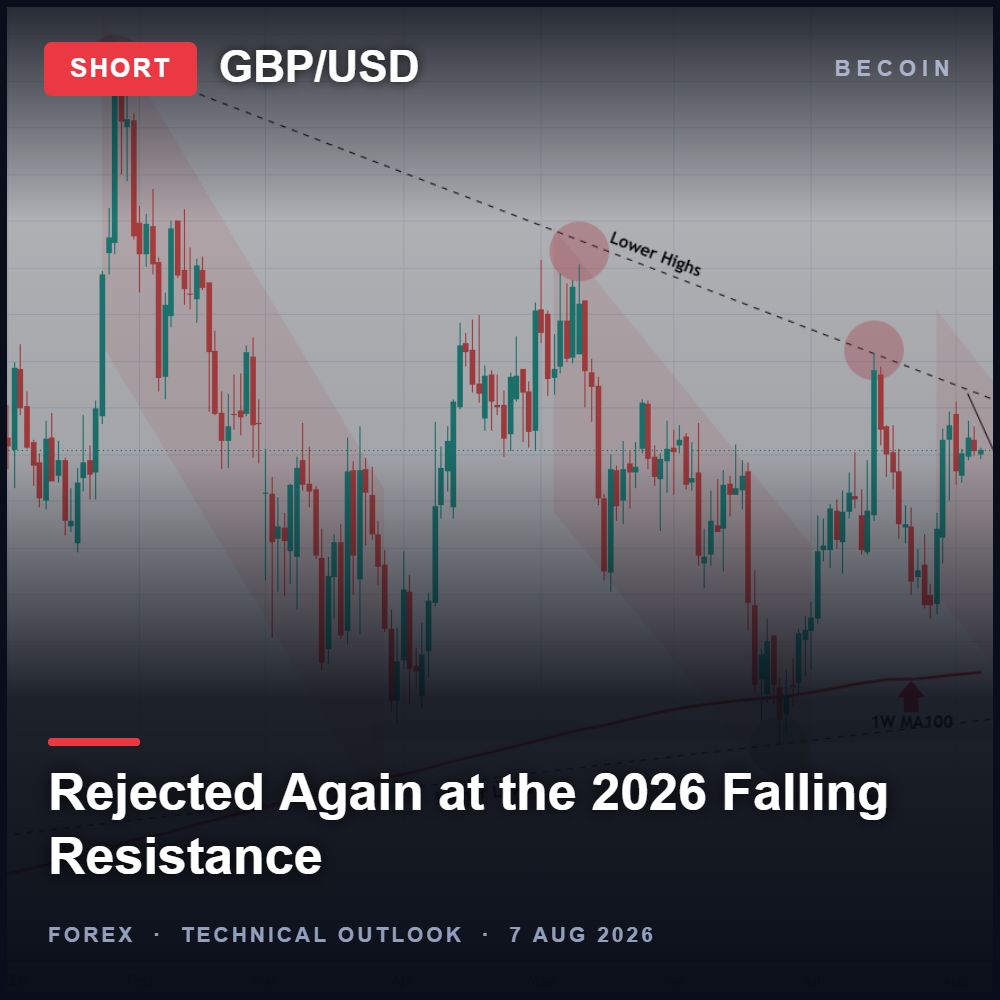
GBP/USD Rejected at the 2026 Trendline — 1.3225 Support Cluster Back in Play
Cable runs into the same wall again
GBP/USD spent the last few sessions grinding higher and, on Monday, tapped the descending trendline that has defined the pair all year. That line connects the lower highs stretching back to the 27 January peak and it has done its job with unusual consistency: every rally since then has stalled somewhere against it. Sterling is now trading near 1.3455 after another failure to clear that ceiling, which is exactly the behaviour a well-respected trendline is supposed to produce.
Why the rejection matters
A trendline only earns respect through repetition, and this one has been tested enough times to be treated as the primary structural barrier on the daily chart. The bearish read, set out in an analysis straightforward: with the pair turned away once more, the market is likely starting a fresh downward leg rather than beginning a genuine trend reversal. Until price closes above the line on a daily basis, rallies are corrections inside a downtrend, not the start of a new one.
The support cluster below
The first meaningful destination on the way down sits around 1.3225, where the weekly 100-period moving average has been catching declines for months. That average does not sit alone. It converges with the rising trendline connecting the higher lows of the past year and with a horizontal support band just underneath, and when three independent references land in the same neighbourhood the zone tends to matter. Buyers have defended this cluster before, and the base case is that they try again.
The scenario nobody is pricing
The more consequential question is what happens if that cluster fails. A weekly close beneath it would remove the last structural floor of the current cycle and would argue that the longer-term bear phase in sterling has further to run, potentially for another year. That is a slower, bigger-picture outcome rather than a swing trade, but it is the reason this support area deserves attention from anyone holding a directional view on the pound.
Managing the trade
For a short bias, the invalidation is clean: a daily close above the 2026 falling resistance. That gives a defined risk point close to current price and a target roughly two hundred pips lower, which is a workable ratio. The complication is timing. This idea is landing alongside the US employment report, and dollar-driven volatility can blow through technical levels in both directions before settling. Reducing size into the release, or waiting for the dust to clear before committing, is the more disciplined approach.
Bottom line
Sterling remains capped by the trendline that has controlled it since January, and the path of least resistance points back toward the 1.3225 support cluster. A daily close above the line changes the story; until then, the burden of proof stays with the bulls. Nothing here is investment advice, and every setup can fail.

IQ Option vs Deriv Chart Comparison
The Night I Realized My Charts Were Lying to Me It was three in the morning, the exact hour when the market looks either like a goldmine or a psychological hazard. I was sitting in front of two monitors, a lukewarm mug of coffee in hand, watching a critical support level on EUR/USD. On my […]

Trading Currency Strength Instead of Single Pairs
It was a Tuesday afternoon when I realized I was fighting a losing battle against a ghost. My screen was a chaotic web of indicators. I had the EUR/USD chart open, a moving average crossing over here, a relative strength index flashing oversold there, and a price action setup that looked textbook perfect. I clicked […]

The Day I Stopped Trading and Finally Started Making Money
It was a rainy Tuesday morning, and I was staring at my screen with a familiar knot in my stomach. The previous three days had been a slow, agonizing slide into the red. I had given back two weeks of hard-earned profits in less than seventy-two hours. Every asset I clicked on looked like a […]

The Rookie Dashboard: My Raw Hunt for the Best Beginner Broker in 2026
We have all been there. It is late at night, your morning coffee is hours away, and you are staring at a screen pulsing with bright green and red lines. You have twenty dollars burning a hole in your digital wallet and a sudden, burning desire to conquer the financial markets. That was me exactly […]

Which Broker Has Better Risk Management Tools?
The burning smell of my own account blowing up is a scent I will never forget. It was a rainy Tuesday afternoon a few years back. I sat huddled over my laptop, watching a currency pair oscillate. Confident, arrogant, and entirely unprotected, I clicked buy. Minutes later, a sudden market spike completely wiped out my […]

Binomo vs IQ Option for Small Accounts: Which Platform Is Better for Beginners in 2026?
Most people entering online trading do not start with thousands of dollars. They start small. Usually with $10, $20, or maybe $50. That small balance changes everything about how a trader behaves. Every loss feels bigger, every win feels emotional, and every mistake has a stronger impact on the account. This is exactly why beginner […]