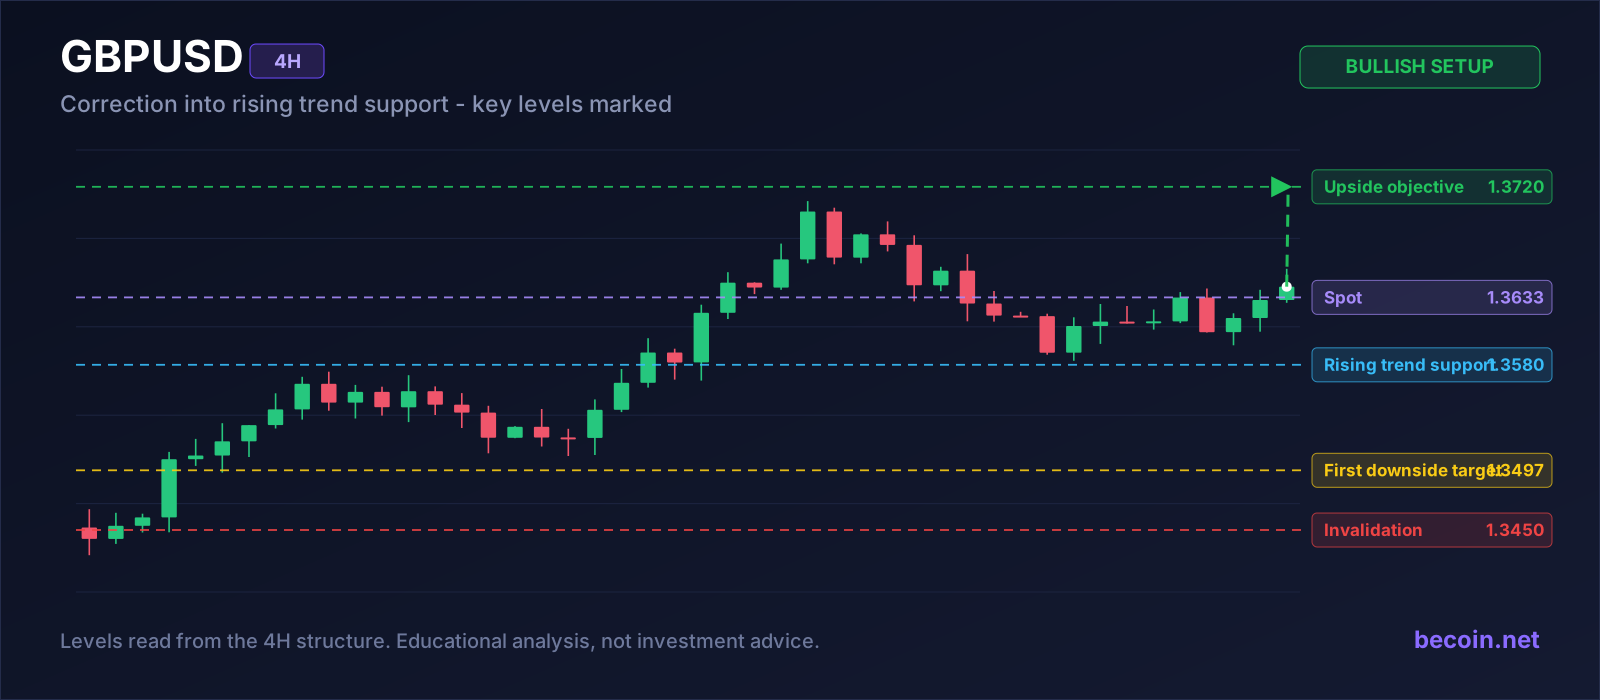
GBP/USD Trend Support at 1.3580 Faces a Test
Sterling has been one of the steadier majors this month, but steady is not the same as one-directional. GBP/USD pushed up into the 1.3690 area, ran out of buyers, and has since been rolling back toward the rising trendline that has underpinned the whole advance. At roughly 1.3633 the pair is caught between an uptrend that has not technically broken and a short-term structure that is clearly losing altitude.
Why the GBP/USD trend support at 1.3580 matters
The line in question is not a fresh drawing. It connects the swing lows built over the past several weeks and has been touched twice already, both times producing an immediate bounce rather than a slow grind. That behaviour is what separates a trendline traders actually respect from one that simply happens to fit the data.
What makes the current approach more interesting than the previous two is convergence. The trendline arrives at roughly the same place as the horizontal shelf left behind by the mid-month consolidation, so 1.3580 is doing double duty as diagonal and horizontal support. Zones that stack two independent reasons to defend a price tend to produce sharper reactions than zones built on one.
The levels that matter
| Level | Price | Why it matters |
|---|---|---|
| Upside objective | 1.3720 | Prior swing high and the natural target if support holds |
| Spot reference | 1.3633 | Mid-correction, above support but below the highs |
| Trend support | 1.3580 | Rising trendline stacked on a horizontal shelf |
| First downside target | 1.3497 | Where sellers aim once the diagonal cracks |
| Invalidation | 1.3450 | Below here the uptrend is finished rather than correcting |
The case for buying the test
The clean version of this trade is patient. You let price reach 1.3580, you wait for a four-hour candle to close back above the trendline rather than through it, and you take the entry on that confirmation with a stop under 1.3520. The reward runs to 1.3720 for roughly a two-to-one payoff, and better than that if the pair extends into the prior range.
The impatient version, resting limit orders directly in the zone, offers a better fill and a worse survival rate. Trendlines break more often than chart tutorials suggest, and a limit order sitting in the zone has no way of telling the difference between a bounce and a breakdown until it is already wrong.
The bearish alternative
If 1.3580 goes on a closing basis, the picture changes quickly. The first stop below is 1.3497, an obvious level because it marks the last untested consolidation low, and beneath that 1.3453 comes into view. Traders who were long the trend would be flat, and traders who like fading failed support would have a defined idea with the broken line acting as new resistance.
None of this happens in a vacuum. Sterling remains sensitive to the shape of UK rate expectations, and a surprise in either the inflation or the labour data can push the pair through a trendline in a single session. Structure tells you where the market has been paying attention. It does not tell you what the next release will say.
Turning the levels into a plan
Mark 1.3580 and 1.3720 before the London open, decide in advance which candle close you will accept as confirmation, and size the trade off the distance to 1.3520 rather than off how strong the setup looks. That single discipline removes most of the improvisation that turns a good level into a bad trade.
For a second read alongside your own, the Becoin.net Premium Forecast tracks projected ranges for the majors and updates them as the structure shifts, and the access levels are listed on the Becoin.net Tariff Plans page.

IQ Option vs Deriv Chart Comparison
The Night I Realized My Charts Were Lying to Me It was three in the morning, the exact hour when the market looks either like a goldmine or a psychological hazard. I was sitting in front of two monitors, a lukewarm mug of coffee in hand, watching a critical support level on EUR/USD. On my […]

Bitcoin slips to $65,741 as oil and yields test the breakout
Bitcoin is near $65,741 as rising oil and Treasury yields test the $65.7K breakout floor. Here are the levels that confirm or invalidate the move.

$10 to $50 Trading Challenge – Strategy + Real Results (Case Study)
Turning $10 into $50 sounds easy until you actually try it. Small accounts expose every weakness in your trading. One bad decision can erase hours of progress, and emotional trading becomes much harder to control when every dollar matters. This case study breaks down how a $10 account was realistically grown to $50 using a […]

EUR/USD holds 1.1414 before the ECB decision: three scenarios
EUR/USD traded near 1.1414 before the ECB’s July decision. Here is what a hold, hawkish hold or surprise hike could mean for 1.1350 and 1.1480.

Which Broker Has Faster Withdrawals? Real 2026 Comparison for Traders
When most beginners choose a broker, they focus on bonuses, signals, or flashy interfaces. But after trading for a while, you realize one thing matters more than almost anything else: How fast can you actually withdraw your money? A broker can look perfect until your first withdrawal request gets stuck in “processing” for three days. […]

Best Broker for One Trade a Day Strategy in 2026
Most traders lose money because they trade too much. They enter random setups, chase candles, overreact emotionally, and turn a simple strategy into pure gambling. That is exactly why the one trade a day strategy is becoming more popular among smart traders in 2026. Instead of sitting in front of charts all day, this approach […]