GBP/JPY Forecast: 216.13 Sits on 215.84 With 217.60 the Gate
- GBP/JPY trades at 216.13, down 0.09% on the day and pressed into the middle of a tightening 4-hour moving-average cluster.
- Two hawkish central banks are cancelling each other out: the BoE held at 3.75% with three members voting to hike, while the BoJ is live for September.
- The 215.84 average is the floor that decides the next move; a break beneath it opens the 215.00 shelf.
Fundamental Analysis: GBP/JPY
Sterling's side of this cross is being driven by an energy-led inflation relapse. UK CPI rose to 2.9% in July from 2.6% in June, with core steady at 2.6%, and the increase was dominated by a 14.7% monthly jump in gas prices after Ofgem lifted the quarterly cap by 13% to reflect Middle East disruption to wholesale markets. The Bank of England held Bank Rate at 3.75% on 30 July, but the vote was six-three with the minority preferring an increase, and another cap rise is expected in October ahead of the 17 September decision.
The yen leg is the tighter constraint. The Bank of Japan raised its policy rate to 1.0% in June, the highest since 1995, held in July, and now projects FY2026 inflation at 2.5%, with September repeatedly flagged as a live meeting. Joint Japanese and US intervention in late July briefly lifted the currency, but the yen has since retraced more than half of those gains, which tells you how heavy the structural rate differential still is.
The result is compression rather than direction. Both banks are leaning the same way, so the cross has spent a fortnight in an ever-narrower band while carry buyers hold on and rate-convergence sellers wait. Whichever bank moves first in September breaks the deadlock; until then, the pair takes its cues from broader risk appetite and from the oil price feeding both inflation stories.
Technical Analysis: GBP/JPY
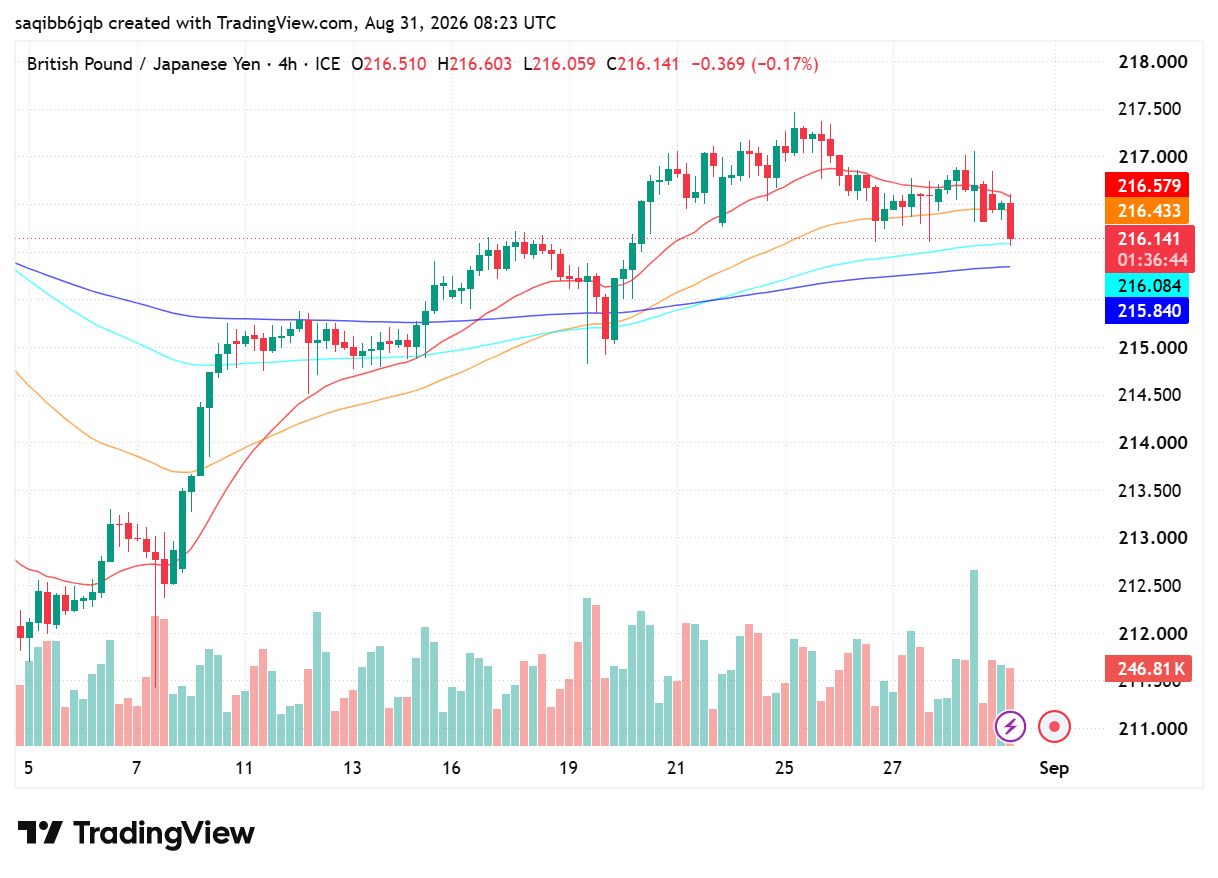
The 4-hour structure begins with the surge off 211.00 on 7 August, a fortnight of consolidation around the 215.00 shelf, and then the push to 217.60 on 25 August that marked the range high. Since then the cross has drifted back into its averages, which have converged tightly at 216.58, 216.43, 216.08 and 215.84 — price at 216.13 is sitting inside them, which is the signature of a market waiting on an event rather than trending.
Resistance is at 216.43 and 216.58 first, then the 217.60 swing high that caps the whole August range. Support is the 216.08 average, then 215.84, and beneath that the 215.00 shelf that held through mid-August. A four-hour close under 215.84 invalidates the constructive read and turns the recent compression into a distribution top.

Deriv Volatility 75 Strategy Backtest: What Actually Works After 1,000 Trades?
The first time I tried trading Volatility 75, I thought I had found the perfect market. No news shocks. No central banks. Just clean, continuous price movement. Within two weeks, I blew my first account. That experience forced me to stop guessing and start testing. Instead of chasing indicators or copying strategies from forums, I […]

IQ Option vs Deriv Chart Comparison
The Night I Realized My Charts Were Lying to Me It was three in the morning, the exact hour when the market looks either like a goldmine or a psychological hazard. I was sitting in front of two monitors, a lukewarm mug of coffee in hand, watching a critical support level on EUR/USD. On my […]

EUR/USD holds 1.1414 before the ECB decision: three scenarios
EUR/USD traded near 1.1414 before the ECB’s July decision. Here is what a hold, hawkish hold or surprise hike could mean for 1.1350 and 1.1480.

Bitcoin slips to $65,741 as oil and yields test the breakout
Bitcoin is near $65,741 as rising oil and Treasury yields test the $65.7K breakout floor. Here are the levels that confirm or invalidate the move.

Trading Currency Strength Instead of Single Pairs
It was a Tuesday afternoon when I realized I was fighting a losing battle against a ghost. My screen was a chaotic web of indicators. I had the EUR/USD chart open, a moving average crossing over here, a relative strength index flashing oversold there, and a price action setup that looked textbook perfect. I clicked […]

The Day I Stopped Trading and Finally Started Making Money
It was a rainy Tuesday morning, and I was staring at my screen with a familiar knot in my stomach. The previous three days had been a slow, agonizing slide into the red. I had given back two weeks of hard-earned profits in less than seventy-two hours. Every asset I clicked on looked like a […]