FTSE MIB Forecast: Milan Defends 53,700 After a Record Run
The FTSE MIB forecast follows a record and a pause
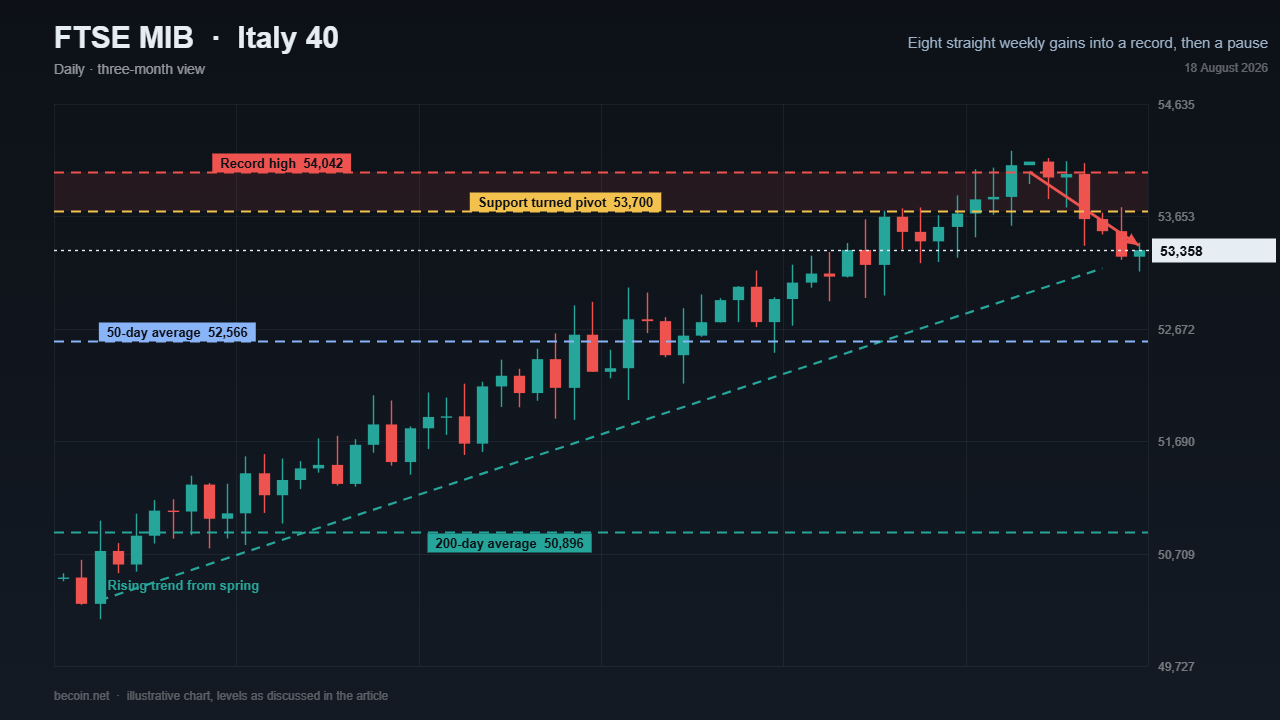
Milan has been one of the strongest developed-market benchmarks of 2026. The index printed a record 54,041.80 in August after eight consecutive weekly gains, and is up roughly 24% over twelve months against a 52-week low near 41,360. On 18 August it slipped 0.43% to 53,358.42, leaving it about 1.3% under the high.
A pause after a run like that is unremarkable. What makes it worth mapping is that the index has now closed below the level that had been acting as support during the advance, which turns a straightforward uptrend into a test.
53,700 has flipped from floor to gate
Through the record-setting stretch, 53,700 was the shelf buyers defended on every dip. Price is now beneath it, which means the same level becomes the first resistance on any attempt to retake the highs. That is the standard behaviour of a broken support and it gives a clean, testable line: reclaim 53,700 on a closing basis and the pause was noise; keep failing there and the record becomes a top rather than a waypoint.
Above it the objectives are close together — 53,980 and then the 54,042 record — with the round 55,000 as the next psychological marker beyond. Below it, the structure remains constructive: the 50-day average sits near 52,566 and the 200-day near 50,896, so the index would have to give back roughly 1.5% before even the shorter average comes into play.
The trend is intact, the momentum is not
Every moving average from the shortest to the longest still reads as a buy signal, and price sits comfortably above both major ones. That is the definition of an intact uptrend. But the fourteen-day relative strength index has cooled back toward neutral around 48 while stochastic measures printed overbought at the high, which is the classic profile of a market that has run hard and needs time rather than one that has broken.
One caveat on the numbers: several technical data feeds for this index are running a session or two behind, so treat the moving-average levels as approximate rather than precise. The structure they describe is right; the last decimal is not worth trading. Level maps kept current across European benchmarks are in the Becoin.net Premium Forecast.
The ECB is tightening, and Milan likes it
The macro backdrop here is genuinely unusual. The European Central Bank raised all three of its key rates by 25 basis points on 11 June, its first increase in almost three years, taking the deposit rate to 2.25% on the back of energy-driven inflation, then held in July. Staff projections put headline inflation near 3.0% for 2026 with growth trimmed to 0.8% and the target not reached until late 2027.
For most equity markets that combination is a headwind. For Milan it has been a tailwind, because of what the index is made of. The two largest constituents are banks, and higher-for-longer rates support net interest income directly. Domestic consolidation has added a second layer, with a live cross-border takeover in the approval pipeline and a run of mergers among mid-sized Italian lenders keeping the sector bid through a strong first-half earnings season.
Energy and defence are doing the rest
The other two engines are straightforward. Crude above the $90 handle on Strait of Hormuz risk lifts the index's large integrated energy name, which has added meaningfully on individual sessions. European rearmament continues to support the defence and shipbuilding constituents.
The obvious vulnerability is concentration in the other direction. Autos have lagged sharply on Chinese electric-vehicle competition, and utilities have been soft. More to the point, the sell-side debate has already moved on from whether Milan goes higher to whether Italian banks have hit a valuation ceiling — which is a polite way of asking whether anything else can take over the leadership. A market this dependent on one sector is a market where position sizing matters, and the limits attached to each account tier are set out on the Becoin.net Tariff Plans page.
The level that ends the thesis
Two closes settle it. Reclaim 53,700 and the record at 54,042 is back within a single session's range, with 55,000 as the extension objective and the bank-led trend intact. A daily close below 52,566 breaks the 50-day average and turns this from a pause into a correction, with the 200-day near 50,896 as the level that would actually threaten the uptrend. The sovereign spread has been steady and the earnings season delivered, so the burden of proof still sits with the bears — but they now have a broken support level to work with, which is more than they have had all summer.

Can You Start Trading with $10 on Deriv?
A lot of beginners enter trading with the same question: “Is $10 actually enough to start trading on Deriv?” The short answer is yes. But the real answer is more complicated. You can start with $10 on Deriv, but whether you can survive, learn, and grow that account depends entirely on your expectations, discipline, and […]

Deriv vs IQ Option for Beginners in 2026: Which Platform Is Better to Start With?
Choosing your first trading platform can decide whether you stay consistent or quit after blowing your first account. Most beginners do not fail because trading is impossible. They fail because they start on platforms that confuse them, encourage emotional trading, or make risk management difficult. Two names that often appear in beginner discussions are Deriv […]

Capital Core for US Traders: Can Americans Use It Safely?
I’ll be honest: when I first started digging into Capital Core for US traders, I wasn’t looking for hype. I was looking for a boring answer. Can I sign up from the US?Can I actually trade?And the real question nobody asks loudly enough: if I win, can I withdraw without drama? That last one matters […]

Capital Core Account Types Explained: Which One Fits Your Trading Budget?
When I first started looking at Capital Core account types, I made the same mistake most traders make. I looked at the bonus first. Then I looked at the leverage. And only after that did I start asking the question that actually matters: Which account can I realistically manage without forcing trades just because I […]

Deriv Volatility 75 Strategy Backtest: What Actually Works After 1,000 Trades?
The first time I tried trading Volatility 75, I thought I had found the perfect market. No news shocks. No central banks. Just clean, continuous price movement. Within two weeks, I blew my first account. That experience forced me to stop guessing and start testing. Instead of chasing indicators or copying strategies from forums, I […]

Finding the Best Trading Broker for Side Income: My Raw, First-Hand Journey to Consistent Daily Wins
Six months ago, I sat at my kitchen table staring at an accumulation of household bills, realizing my primary salary was no longer cutting it. I didn’t want a second job that required clocking into a physical location or taking endless boss mandates after hours. I needed a flexible, scalable side income. That night, I […]