EUR/CAD Forecast: 1.6000 Support vs the 1.6270 Ceiling
EUR/CAD Forecast: A Pair That Refuses to Pick a Direction
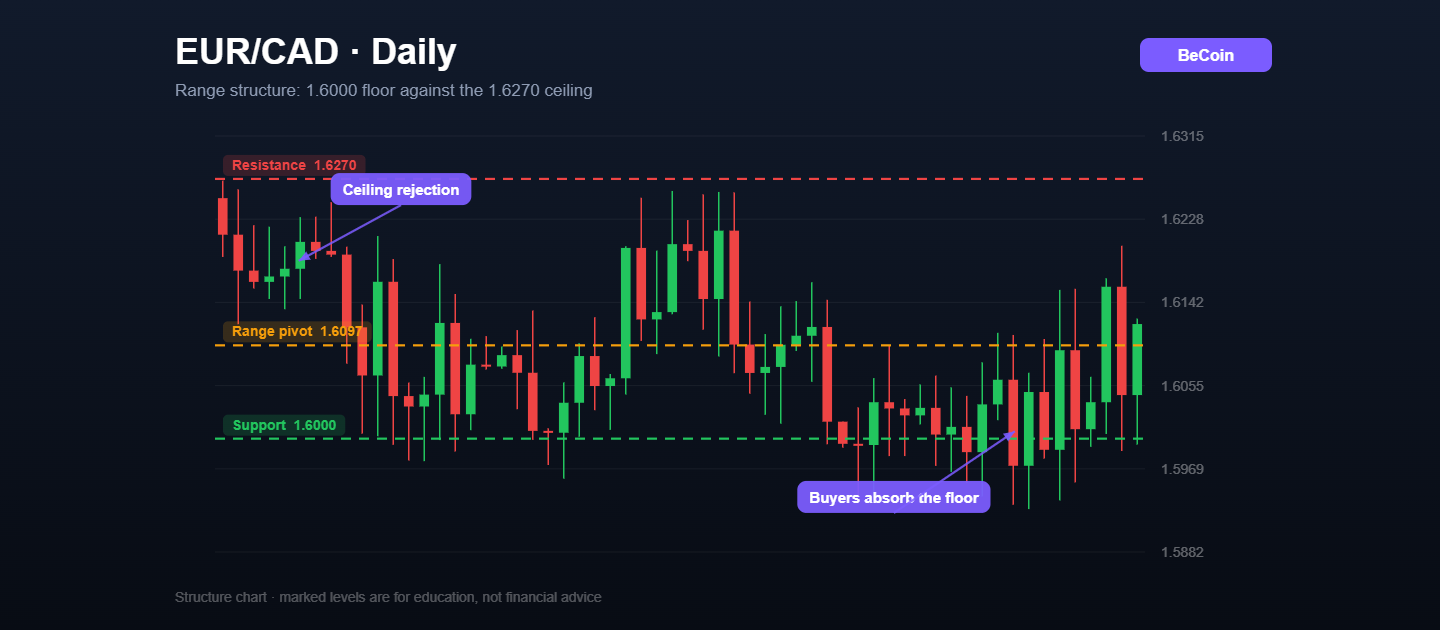
EUR/CAD has spent the past several weeks doing the one thing that frustrates trend traders and quietly rewards patient ones: almost nothing. The pair keeps rotating between roughly 1.6000 on the downside and 1.6270 on the upside, and every attempt to escape has been faded back inside the box within a couple of sessions. Community charts published on multiple platforms arrive at the same picture from very different methods, which is usually a sign the levels are real rather than imagined.
The 1.6000 Floor Keeps Doing Its Job
The 1.6000 to 1.6030 band has been tested repeatedly and has held every time. What makes it interesting is not the round number but the behaviour around it. Wicks push below, buyers absorb the supply, and the candle closes back inside the range. That is absorption, not a breakdown. A weekly reversal candle near the 38.2% retracement has been flagged by several chartists as the reason this floor carries more weight than a simple horizontal line would suggest.
1.6270 Is the Level Bulls Still Have to Take
On the other side, the 1.6240 to 1.6270 band has capped every rally. Sellers defend it with conviction, and the bearish setups circulating around the pair almost all begin with a rejection there before working down toward 1.6038, then 1.6000, then 1.5980. Until EUR/CAD produces a daily close above 1.6270 with genuine follow-through the next session, the burden of proof sits squarely with the buyers.
The Macro Stand-Off Behind the Chart
Range behaviour usually reflects a real deadlock in the fundamentals, and this pair is a clean example. Eurozone inflation has been holding steadier than most desks expected, which stops the euro from sliding. Canadian inflation has been cooling, while crude has not given the loonie a decisive push in either direction. Neither central bank is handing traders a clean narrative, so price does what it always does without one: it rotates.
Trading the Range Without Getting Chopped Up
The practical approach shared by most published setups is mean reversion with tight invalidation. Buyers look for entries into 1.6000 to 1.6070 with stops below the range low and first objectives at 1.6130 to 1.6150. Sellers run the mirror image from 1.6240 to 1.6270 back toward 1.6100. The expensive mistake is chasing the middle of the range, where reward is thinnest and noise is loudest. If you would rather track these levels as they update than redraw them by hand each morning, Becoin.net Premium Forecast follows this kind of compression across the major crosses, and Becoin.net Tariff Plans sets out which access tier matches how often you actually trade.
What Would Change the Picture
Two events end the deadlock. A daily close beneath 1.5980 flips the floor into resistance and opens the path toward 1.5900. A daily close above 1.6270 puts 1.6400 back on the table and turns every dip into a buying opportunity again. Everything between those two lines is noise, and mistaking noise for signal is exactly how range markets drain accounts.
##

EUR/USD holds 1.1414 before the ECB decision: three scenarios
EUR/USD traded near 1.1414 before the ECB’s July decision. Here is what a hold, hawkish hold or surprise hike could mean for 1.1350 and 1.1480.

Trading Currency Strength Instead of Single Pairs
It was a Tuesday afternoon when I realized I was fighting a losing battle against a ghost. My screen was a chaotic web of indicators. I had the EUR/USD chart open, a moving average crossing over here, a relative strength index flashing oversold there, and a price action setup that looked textbook perfect. I clicked […]

IQ Option vs Deriv Chart Comparison
The Night I Realized My Charts Were Lying to Me It was three in the morning, the exact hour when the market looks either like a goldmine or a psychological hazard. I was sitting in front of two monitors, a lukewarm mug of coffee in hand, watching a critical support level on EUR/USD. On my […]

Top 3 Trading Platforms That Actually Pay (Proof-Based)
Choosing the wrong broker at the start is where most traders fail. Not because they lack strategy but because they end up stuck with slow withdrawals, poor execution, or confusing platforms that break decision flow. If your goal is to find the best trading platform for small deposit or the best broker for beginners, you […]

WTI reaches $89.43 as Brent clears $95 on renewed supply risk
WTI traded near $89.43 while Brent moved above $95 as Middle East shipping risk lifted crude for a fifth session. Key levels, catalysts and invalidation.

Bitcoin slips to $65,741 as oil and yields test the breakout
Bitcoin is near $65,741 as rising oil and Treasury yields test the $65.7K breakout floor. Here are the levels that confirm or invalidate the move.