Combining MACD and RSI for Confirmation
It was 2:15 AM on a rainy Tuesday, and I was staring at a clean chart with tears of frustration burning in my eyes. I had just blown another $1,500 position on what looked like a textbook breakout. The Relative Strength Index (RSI) had dipped below 30 into extreme oversold territory, prompting me to hit the buy button with absolute confidence.
Instead of rebounding, the asset plummeted another eight percent. The RSI kept sliding along the bottom, completely indifferent to my financial distress.
That night was a turning point in my trading journey. I realized a hard truth that every retail trader eventually faces: single technical indicators tell incomplete stories. RSI measures price velocity and momentum, but during strong trending markets, it can remain oversold or overbought for agonizingly long periods. On the flip side, trend-following tools like the Moving Average Convergence Divergence (MACD) excel at confirming trend direction, but they suffer from lag, frequently entering trades right when momentum exhausts itself.
The solution was not to discard them, but to pair them together as a dual-confirmation engine. When I began demanding that both RSI and MACD agree before I entered a position, my trading transformed from gambling into a systematic, probabilistic edge.
Decoding the Dynamic Duo: Why RSI and MACD Need Each Other
To understand why this combination works so effectively, you have to look at what each indicator measures under the hood. For a deep dive into individual indicator mathematics, you can check out the comprehensive guides available on the BeCoin technical analysis section.
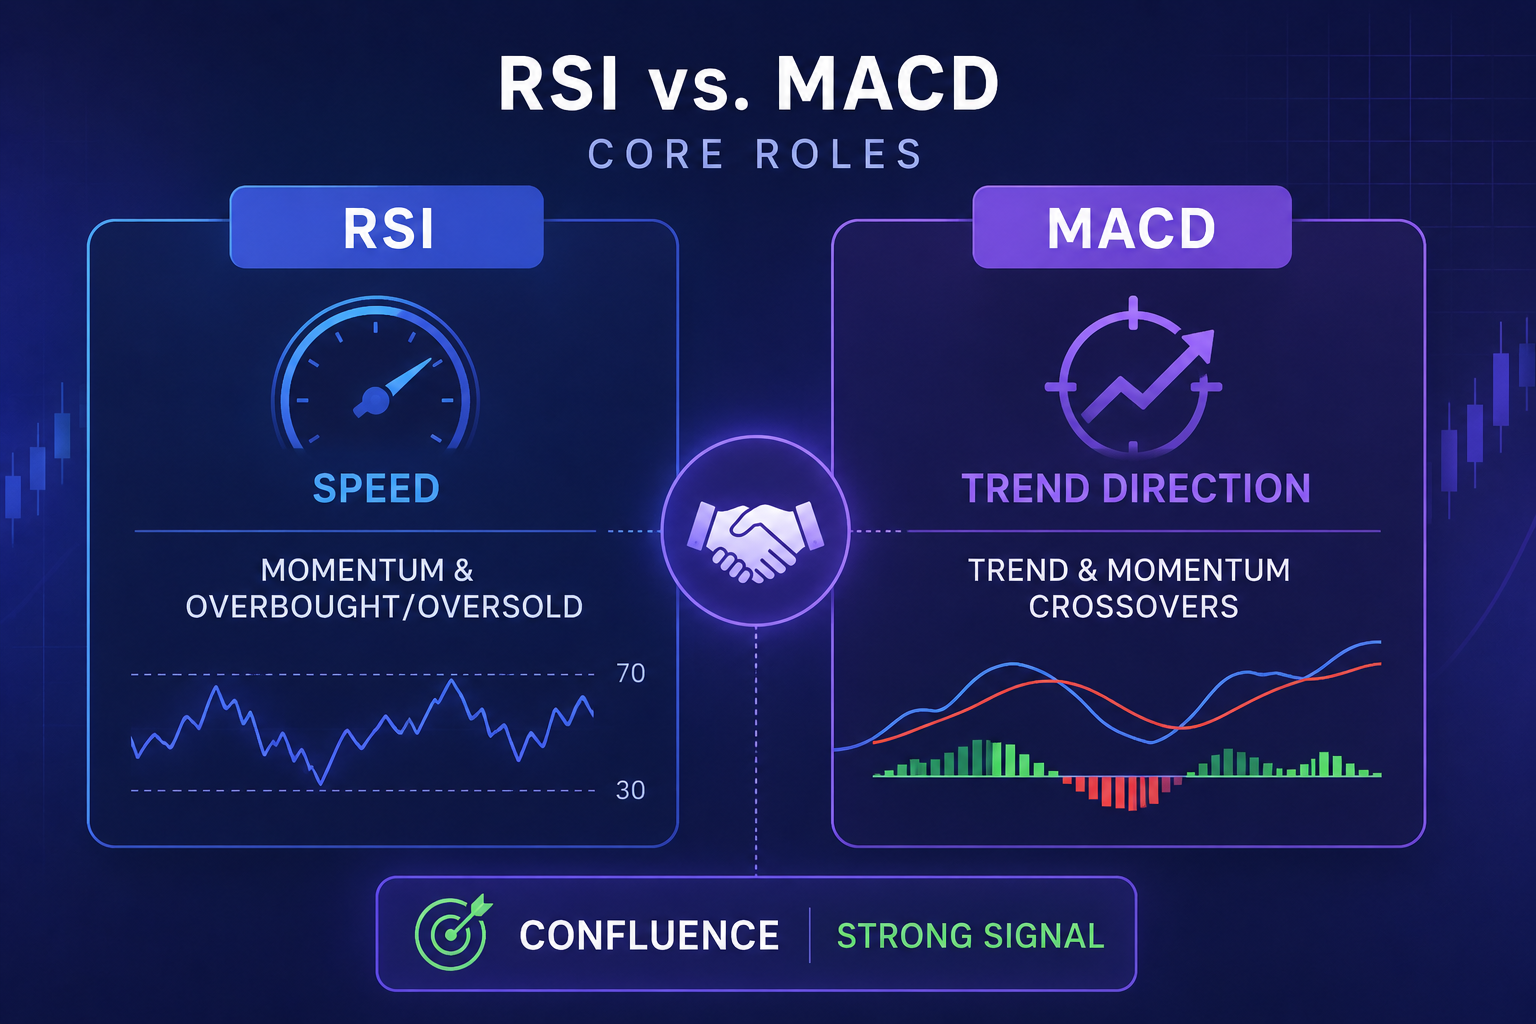
RSI is a bounded oscillator that fluctuates between 0 and 100. It measures the speed and change of price movements, acting like a speedometer. When RSI moves above 70, the asset is considered overbought; when it drops below 30, it is oversold. However, momentum can stay overbought during an aggressive bull run.
MACD, on the other hand, is an unbounded trend-following momentum indicator. It calculates the difference between two exponential moving averages (typically the 12-period and 26-period EMAs) and compares that to a 9-period signal line. The MACD histogram illustrates the distance between these lines, showing whether momentum is expanding or contracting.
When used alone, RSI gives fast signals that are often premature, while MACD gives reliable signals that are often late. When combined:
- RSI acts as your early warning system, alerting you that price is reaching a potential turning point or accelerating momentum.
- MACD acts as your confirmation lock, verifying that structural momentum has actually shifted before you risk your capital.
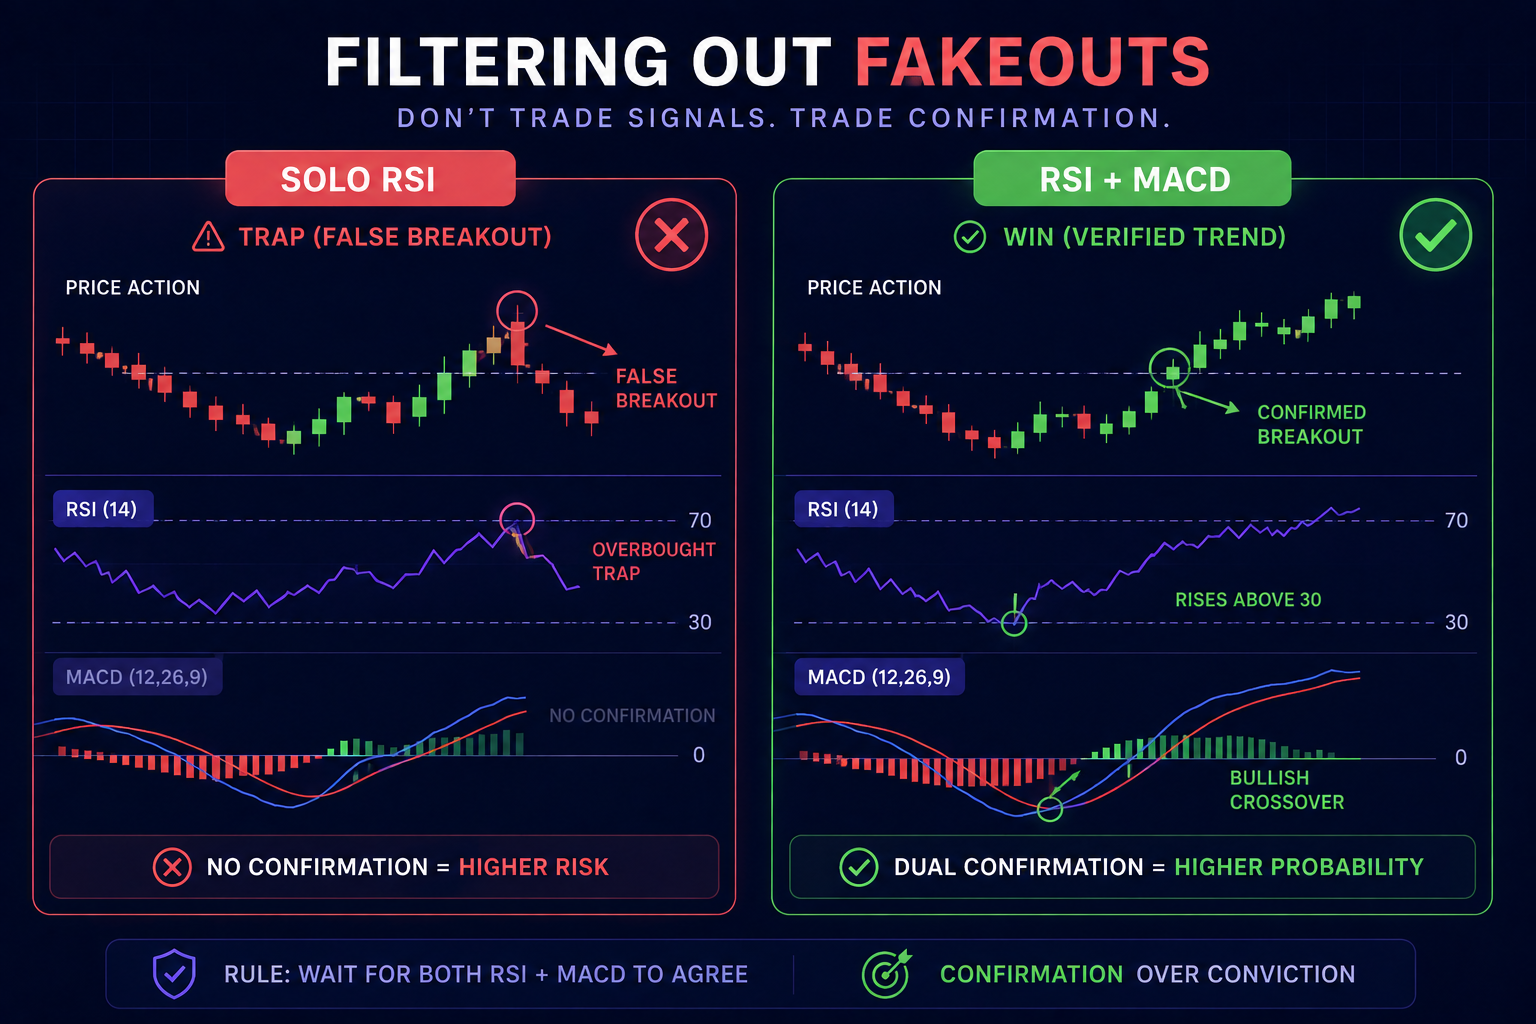
By demanding alignment between both, you dramatically reduce false breakouts and whipsaws.
The Dual-Lock Confirmation Strategy: Three Core Setups
Over years of refining this approach, I have distilled the MACD and RSI combination into three distinct high-probability trade setups.
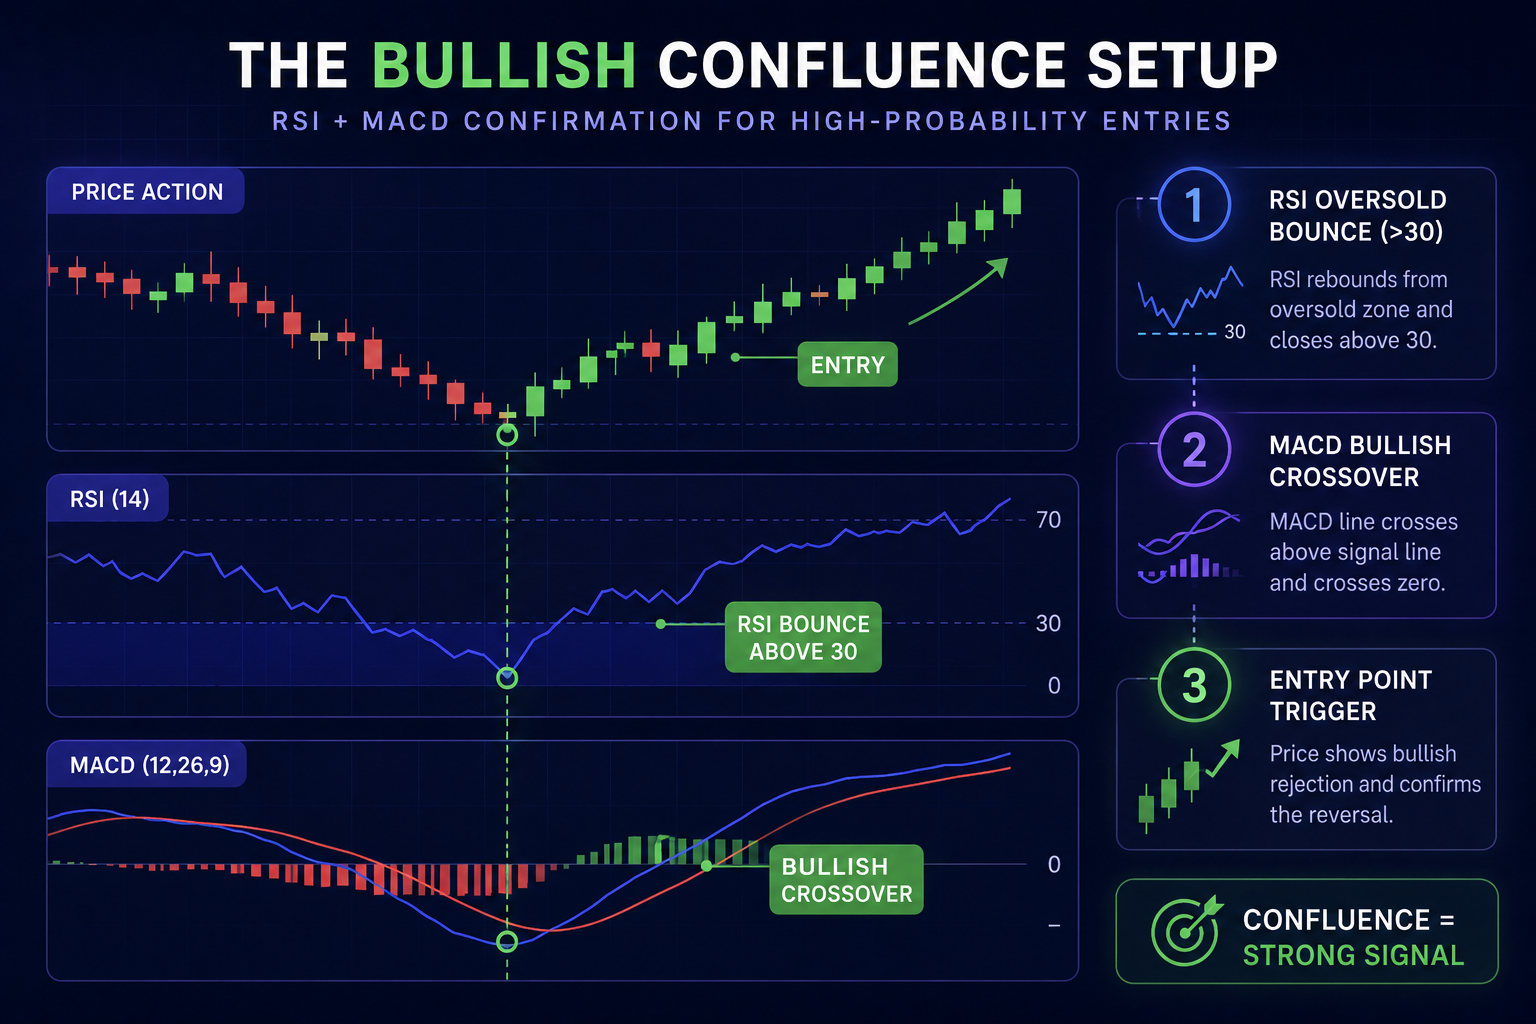
Setup 1: The Bullish Reversal (Divergence + Crossover)
This is my favorite setup for catching major trend shifts at market bottoms.
- RSI Signal: Look for bullish divergence. Price makes a lower low, but the RSI line forms a higher low. This indicates that seller momentum is dying, even though price is drifting lower.
- MACD Confirmation: Do not enter yet. Wait for the MACD line to cross above the signal line, ideally while both lines are below the zero axis, and watch for the histogram to turn green.
- Trigger: Enter a long trade on the close of the candle that confirms the MACD crossover, provided RSI is climbing out of the oversold zone and rising past 40.
Setup 2: The Bearish Exhaustion (Overbought + Death Cross)
When markets rally aggressively into key resistance levels, greed leads traders to jump in right at the top. Here is how I position for the reversal:
- RSI Signal: RSI enters the overbought zone above 70 and begins curving downward, or exhibits bearish divergence (price makes a higher high, RSI makes a lower high).
- MACD Confirmation: The MACD line crosses below the signal line, with the histogram shrinking toward zero and expanding into negative territory.
- Trigger: Enter a short position once the candle closes with MACD confirmation, placing your stop-loss just above the recent swing high.
Setup 3: The Mid-Line Trend Continuation
You do not always need to wait for extreme top or bottom reversals. You can also use this system to ride strong ongoing trends:
- RSI Signal: During a pullback within an uptrend, RSI dips toward the 50 center line and rebounds upward, demonstrating that buyers are defending the mid-point.
- MACD Confirmation: The MACD histogram stays above the zero line and begins expanding higher after a brief period of contraction.
- Trigger: Buy the continuation momentum as price breaks above local resistance.
Step-by-Step Trade Execution: A Walkthrough from My Chart
Let us walk through a trade step-by-step so you can visualize how this works in live market conditions.
Suppose I am observing the 1-hour chart on my trading software. Price has been in a sustained downtrend for two days. Most retail traders are panicking or opening late short positions.
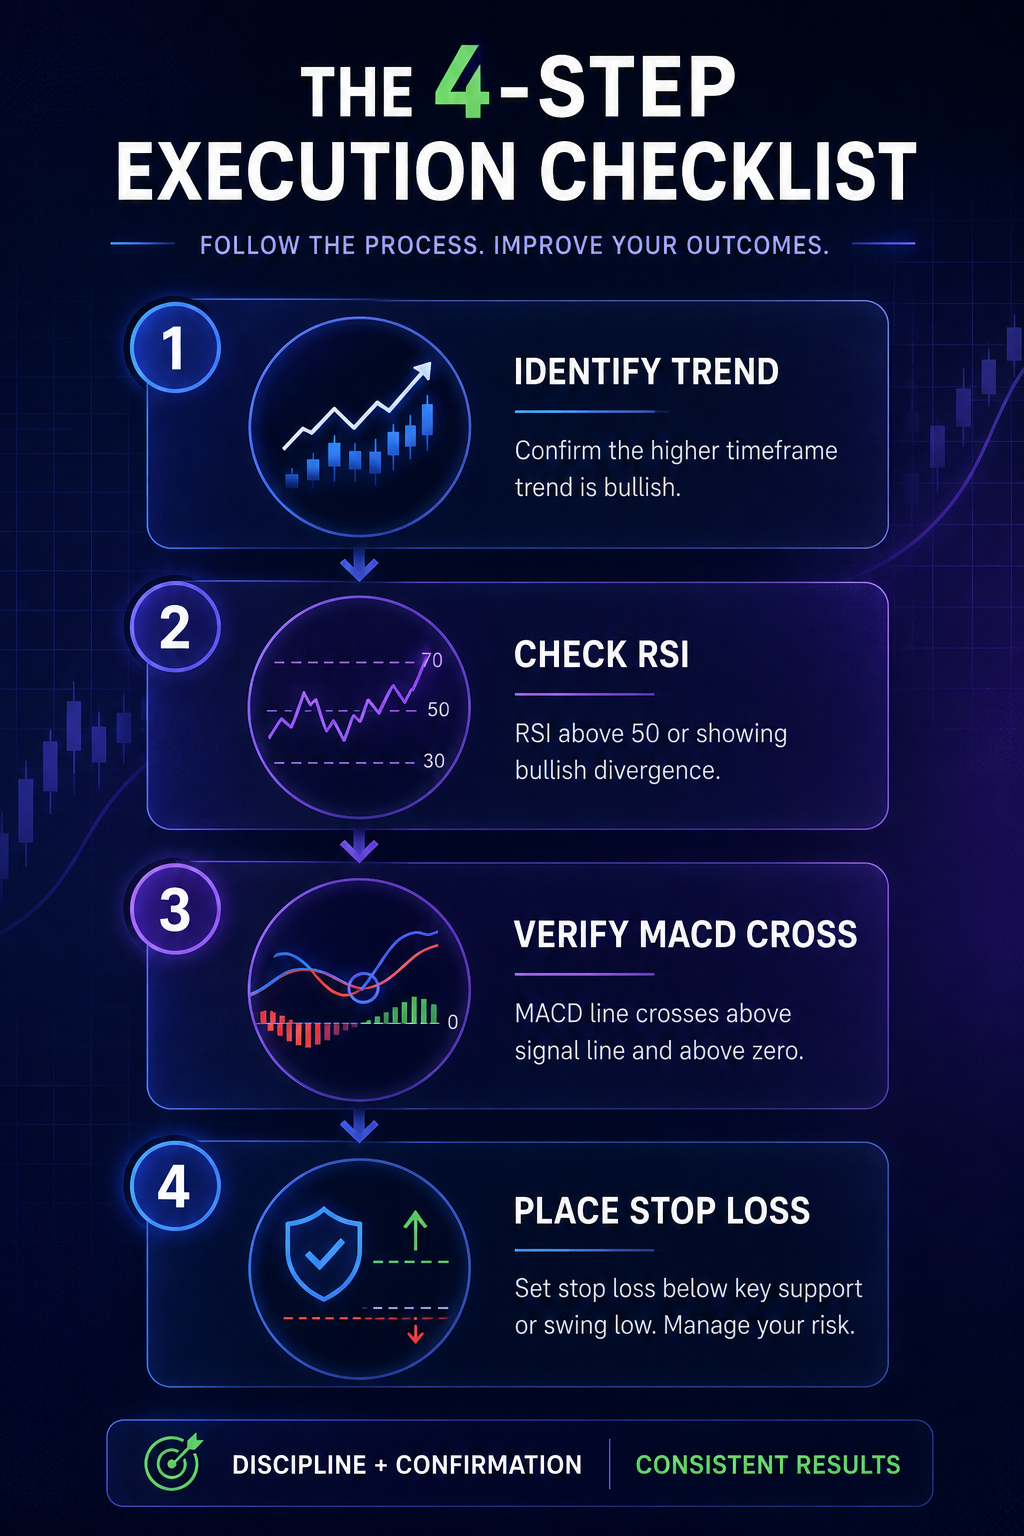
First, I examine the RSI indicator at the bottom of my workspace. I notice that while price hit a new low of $1,200, the RSI printed a reading of 34, which is significantly higher than the 22 reading it printed on the previous price low. This clear bullish divergence is my cue to pay attention.
Next, I look over at my MACD indicator. The MACD line is still below the signal line, meaning the downtrend retains active momentum. I sit on my hands. Three candles later, a strong green engulfing candle appears on price action, and the MACD line cleanly slices upward through the signal line. The histogram ticks above zero.
Now I have dual confirmation: RSI showed me momentum divergence, and MACD confirmed the structural shift.
I place my market entry on the next candle opening. To practice and execute setups like this across real-time feeds, you can utilize versatile broker tools such as the IQ Option platform or the multi-asset charts on Deriv.
If you prefer testing your timing in risk-free demo environments before committing live capital, options like the Pocket Option web terminal or the user-friendly Quotex practice account allow you to hone indicator timing under real market conditions. Additional platforms providing clean charts for indicator alignment include Olymp Trade charts, the ExpertOption trading environment, and the CapitalCore platform.
In our example trade, my stop-loss goes right beneath the swing low structure, giving the asset room to breathe. I target a 1:2.5 risk-to-reward ratio. As the price moves upward, the RSI climbs past 60 and MACD momentum remains positive, enabling me to systematically trail my stop-loss into profit.
Three Costly Mistakes That Ruin Indicator Confluence
Even a robust strategy will fail if applied blindly. Here are the three traps I had to eliminate from my trading routine to stay consistent:
- Ignoring Higher Timeframe Context: Never trade an RSI/MACD buy signal on a 5-minute chart if the daily chart is in a roaring downtrend. Always align your indicator signals with the dominant multi-timeframe trend.
- Trading During Consolidation: RSI and MACD generate constant false signals when price moves sideways in a tight range. If the market lacks volume and direction, stay out. Proper risk parameters are essential during choppy phases; review our BeCoin risk management handbook to protect your balance.
- Tinkering with Standard Settings: Default indicator settings (RSI 14; MACD 12, 26, 9) have survived decades of market cycles for a reason. Avoid constantly tweaking parameters to fit past data, as this leads to curve-fitting and poor forward performance.
Beyond Technical Indicators: Securing Your Real Edge
Mastering technical confluence with RSI and MACD is a vital step toward profitability. It removes emotion, replaces guesswork with systematic rules, and gives you a repeatable framework.
However, indicators are ultimately mathematical reflections of past price data. To achieve consistent outperformance, professional traders combine technical setups with institutional order flow, macroeconomic insights, and real-time market forecasts.
If you want to stay ahead of market shifts instead of merely reacting to them, explore the data projections on the Becoin Forecast Hub. For those ready to step up their trading performance with institutional-grade analysis, daily trade setups, and comprehensive market coverage, upgrade your strategy today by joining the Becoin Premium Tariff Plan.

Best Broker for Learning Price Action in 2026 (Tested by Real Traders)
Most traders think they need a better strategy. What they actually need is a better understanding of price. A few years ago, one of our community members had over ten indicators on his chart. RSI. MACD. Moving averages. Bollinger Bands. Stochastic. Every new YouTube video added another indicator. The result? More confusion. Not more profits. […]
Risk Management for Small Accounts ($10–$50)
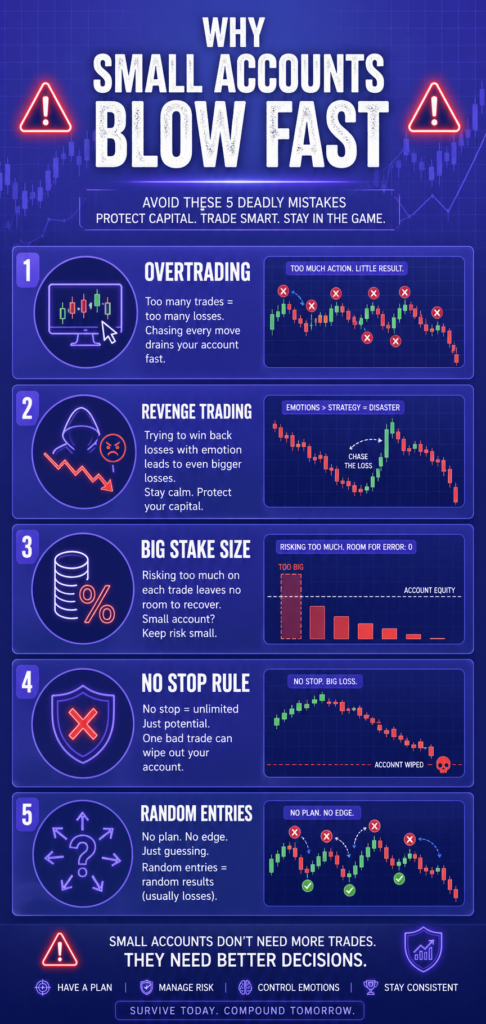
Starting with a small trading account can feel frustrating. You want fast growth, but one bad decision can wipe out weeks of progress. That is why risk management matters more for a $10 account than for a $1,000 account. Many beginners focus only on strategy. They search for the best indicators, signals, or entry methods. […]
Deriv Day Trading vs Offshore Brokers: Execution Model Comparison
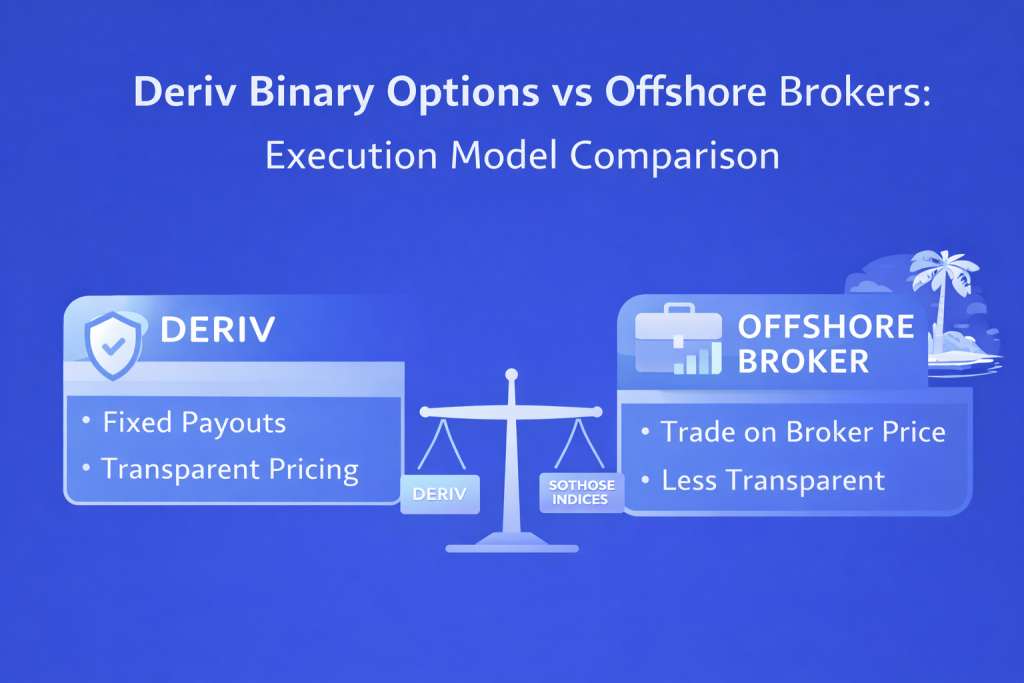
I did not start my trading journey thinking about execution models. Like most beginners, I started with charts, indicators, and the belief that if I could just find the right entry signal, profits would follow. My early trading notebook was full of screenshots of RSI signals, candlestick patterns, and support levels. What it did not […]

Is Binomo Safe or Risky in 2026? A Practical User Checklist (Not a Generic Review)
I still remember the first time I opened Binomo. It wasn’t excitement. It was hesitation. I had already read multiple reviews. Some said it was safe. Others called it risky. None of them felt like they came from someone who had actually traded, deposited, withdrawn, and dealt with real friction. So I decided to test […]

Capital Core Verification Process Explained: KYC, Restrictions, and Withdrawal Delays
I learned something the hard way with offshore-style brokers: the smoothest part is usually opening the account, funding it, and placing the first few trades. The real test starts when you try to move money back out. That’s exactly why I wanted to document the Capital Core verification process from a trader’s perspective, not from […]