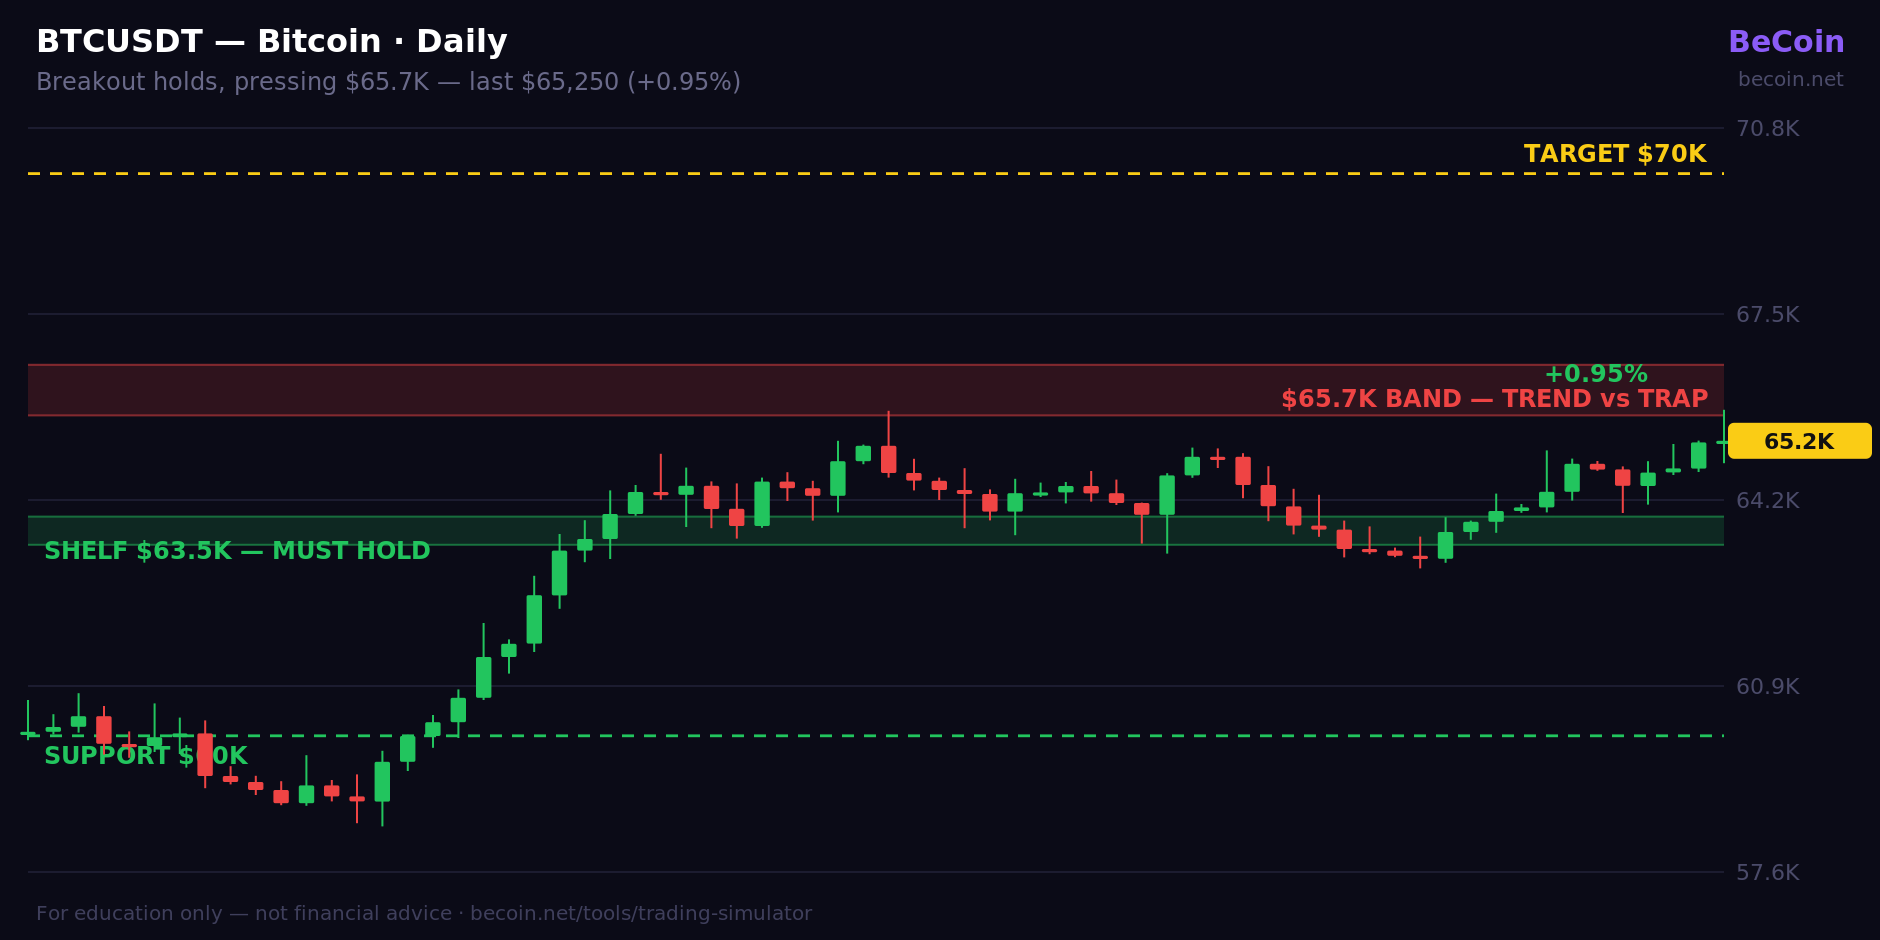
Bitcoin at $65,250: the $65.7K band is the line between trend and trap
Bitcoin is trading at $65,250 on Tuesday, up 0.95% on the day and holding the ground it won last week when it broke out of the six-week box and tagged a three-week high near $65,100. Five sessions later the breakout is still intact — but BTC has stalled directly beneath the one band that decides whether this is a new leg or a slow-motion trap.
Why it matters
The move above $63.5K on July 15 flipped the model bullish for the first time since June. Confirmation, though, isn't a breakout — it's what price does at the next resistance. That level is here now: the $65.7K–$65.8K band is, by the read of the most-followed BTC analysts this week, the exact line that separates a genuine trend recovery from a lower high against May's $82K peak. Clear it and hold, and the recovery earns its keep. Reject it, and every buyer who chased the breakout is suddenly offside — the same pattern that trapped longs in May.
Technical analysis
Support is stacked and clean: the reclaimed breakout shelf at $63.5K must hold on any dip, with $61.3K and the round $60K beneath it as the deeper safety net. Overhead, the immediate wall is $65.7K–$65.8K; a daily close above it opens the $66.6K–$67.6K supply zone, and only a close above $67.5K formally invalidates the bearish lower-high case that has capped every rally since May. Beyond that sits the round $70K, untouched since February. Momentum is constructive but not stretched — the weekly gain was built on higher lows rather than one squeeze candle, which favors a grind over a spike.
BeCoin's forecast read
The model keeps its weekly path bullish while BTC holds above $63.5K, but frames the next 24–48 hours as a decision rather than a trend: the highest-probability path is a test of $65.7K, and the model wants a close through it — not a wick — before extending toward $66.8K and $70K. Its invalidation is the same shelf that triggered the long: a daily close back below $63.5K reverts the whole structure to range logic and reclassifies the breakout as a liquidity grab. In plain terms, the model is long with defined risk, not chasing — $63.5K to stay in, $65.7K to add.
BeCoin's AI model forecasts Bitcoin across six horizons, from tomorrow to ten years, and fires intraday signals the moment they trigger. See the live Bitcoin forecast. Get full access to all 100+ assets → · Educational only — not financial advice.
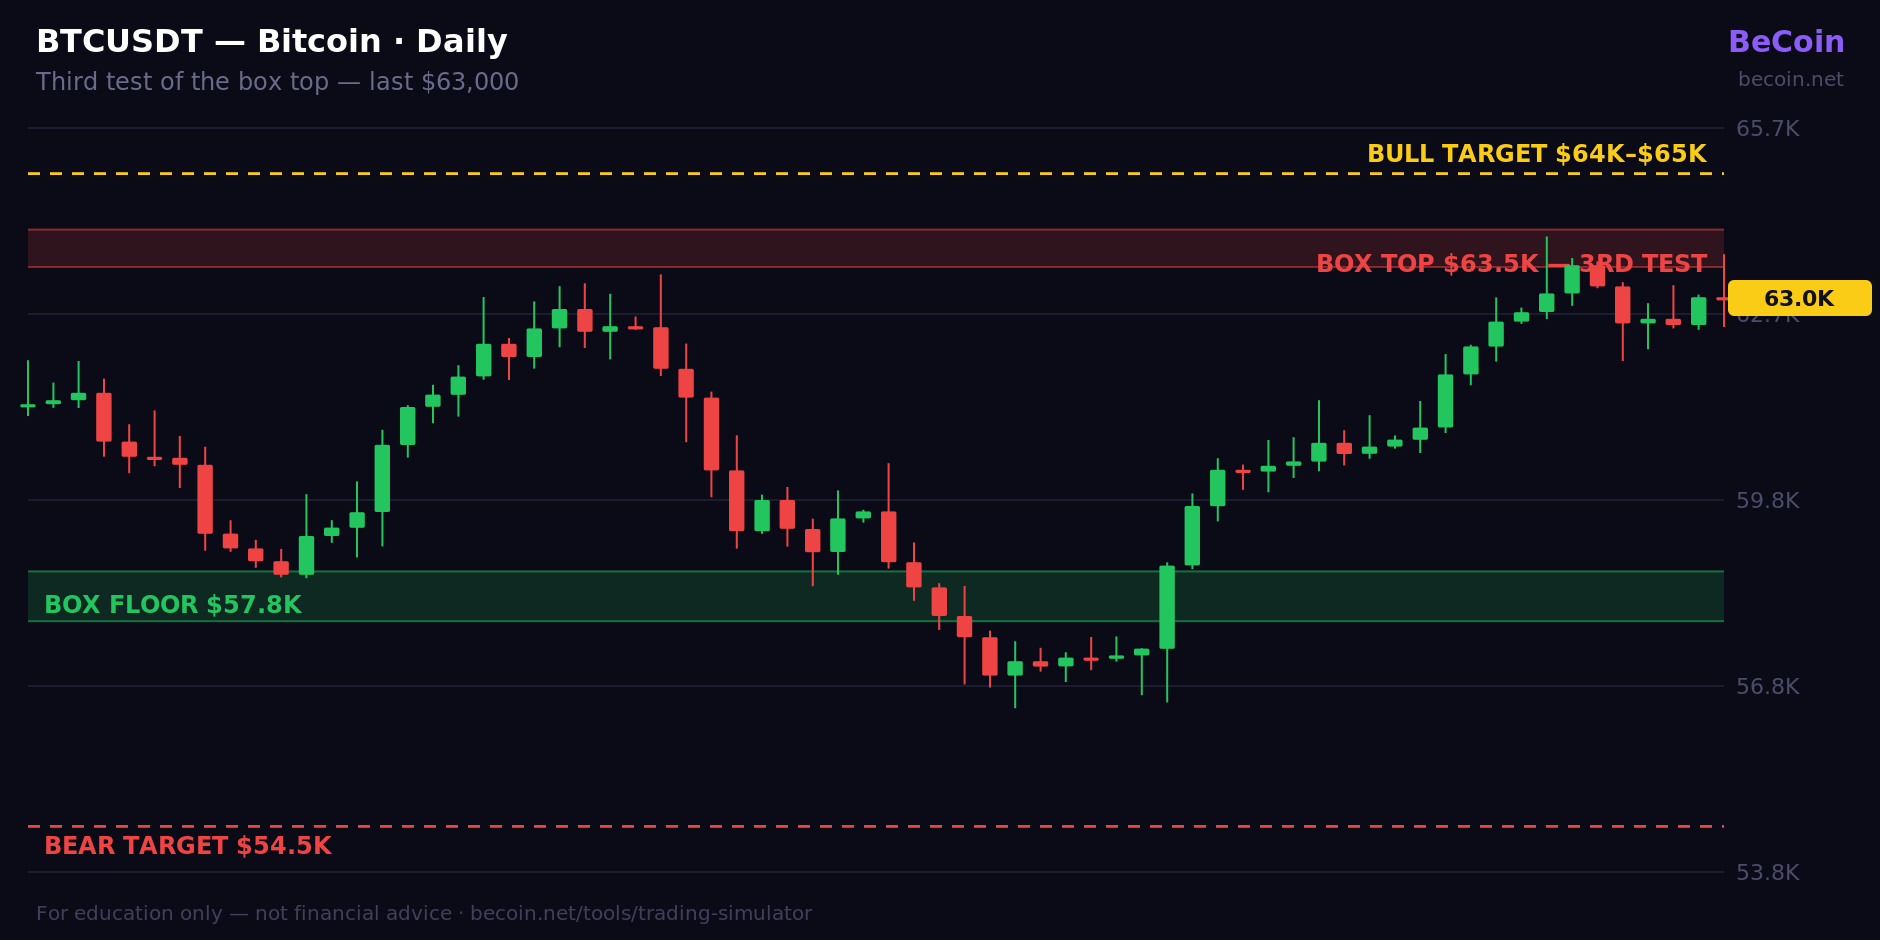
Bitcoin at $63,000: the box top, the $64–65K magnet, and the $54.5K bear case
Bitcoin trades at $63,000, pressing the top of the $57.8K–$63.5K box that has held since June. Trader positioning splits between a breakout to $64–65K and a failed test that sweeps down toward $54.5K. BeCoin's model puts the burden of proof on the bulls at $63.5K.
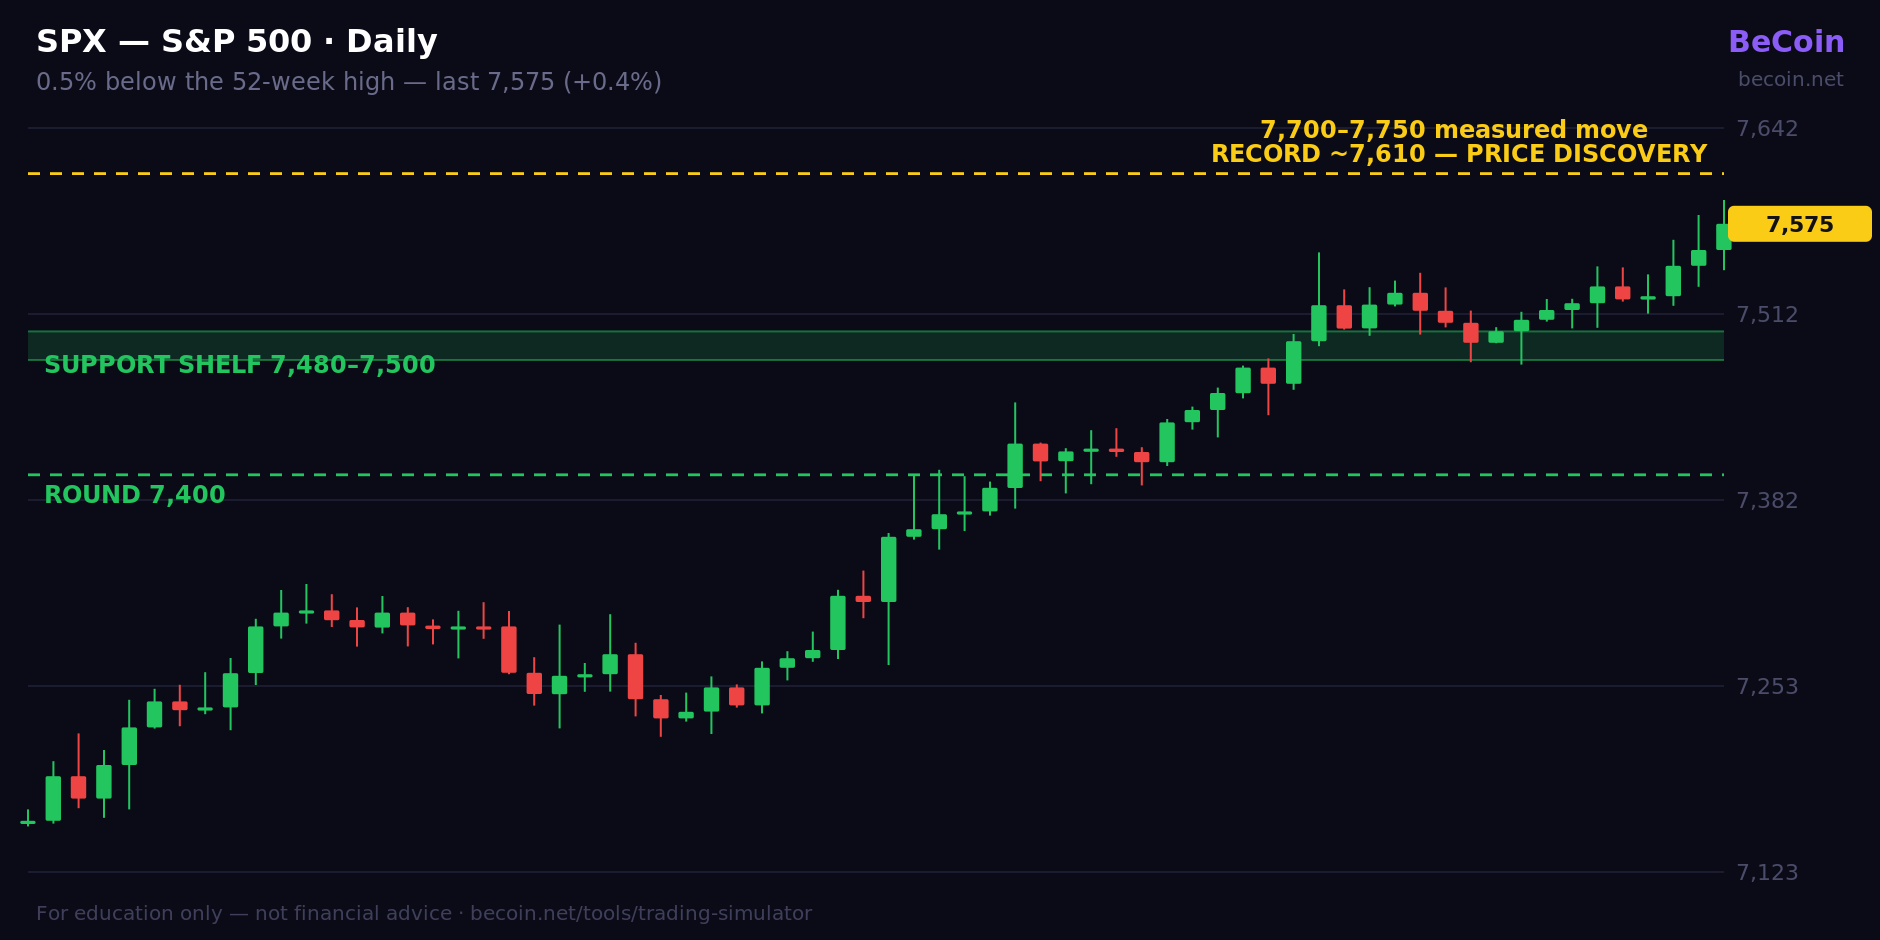
S&P 500 at 7,575, half a percent from a record — while the Fed still talks hikes
The S&P 500 rose 0.4% to 7,575, within 0.5% of its 52-week high, shrugging off Middle East strikes and hawkish Fed pricing. BeCoin's model respects the trend but flags the narrowing gap between record prices and rising-rate expectations.
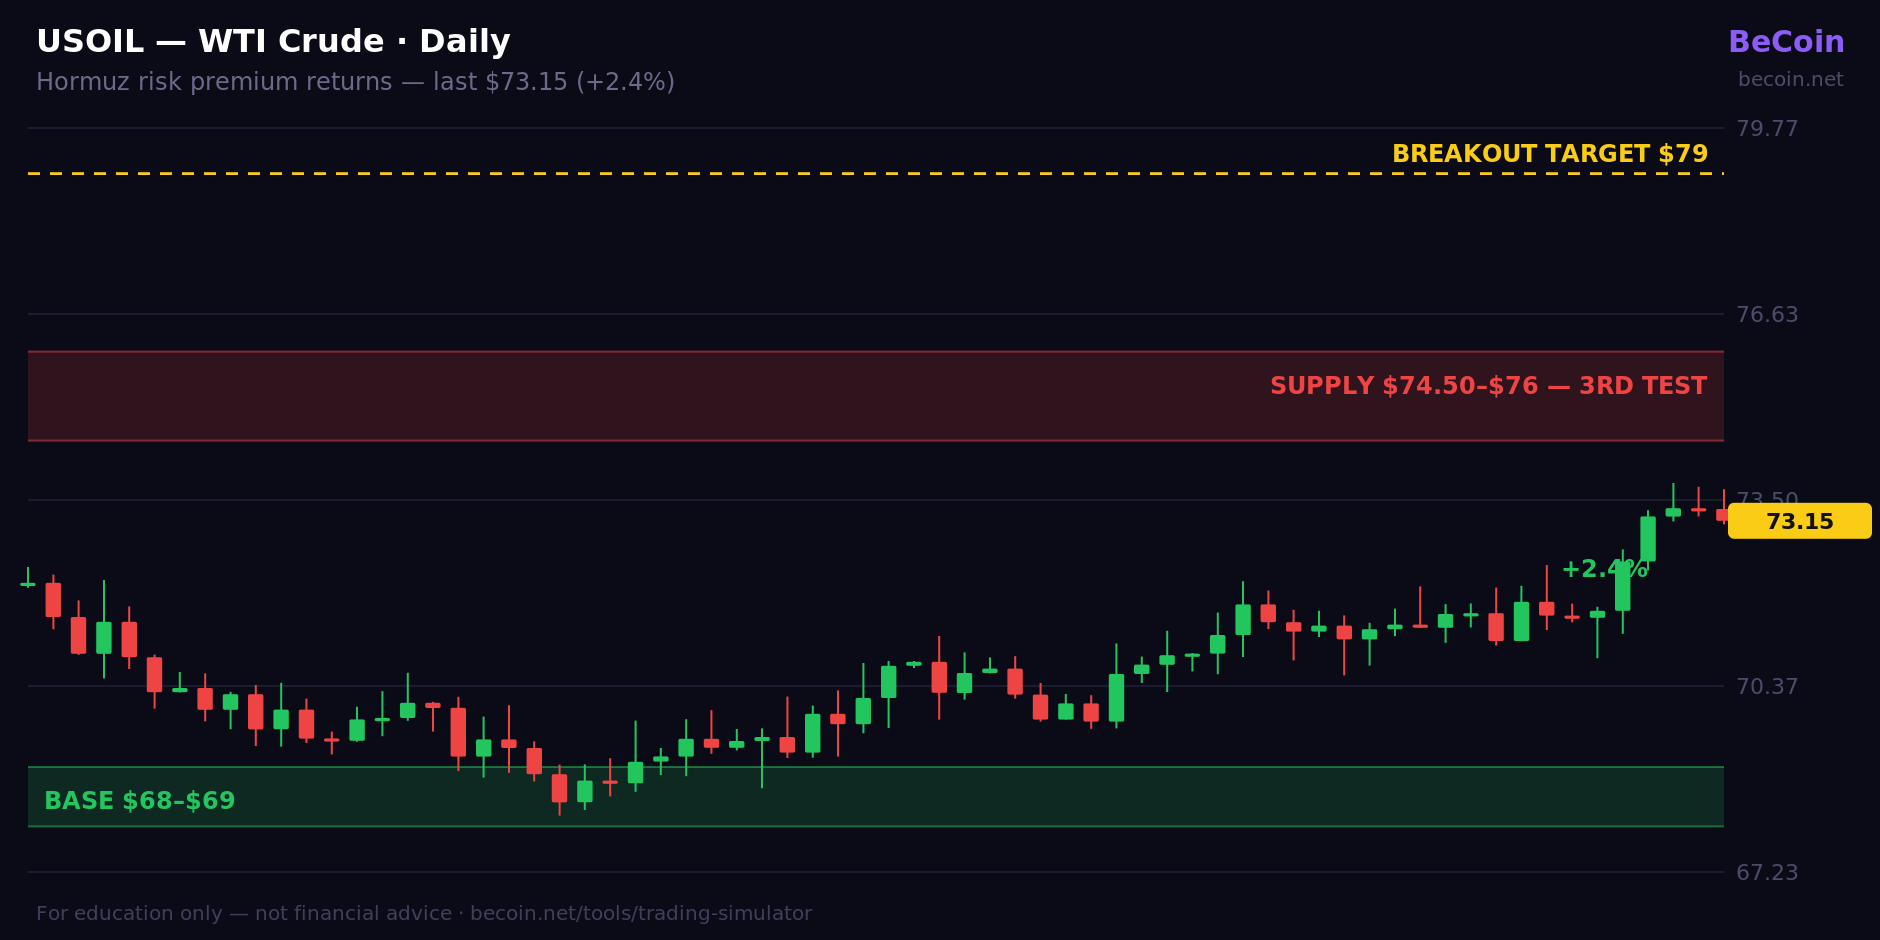
WTI jumps to $73 as Hormuz risk premium returns — recovery leg or headline spike?
WTI rose 2.4% to $73.15 after US strikes on Iran and retaliation on US bases disrupted energy flows through the Strait of Hormuz. BeCoin's model sees the $74–$76 supply band as the test that decides whether this is a new leg or another fade.
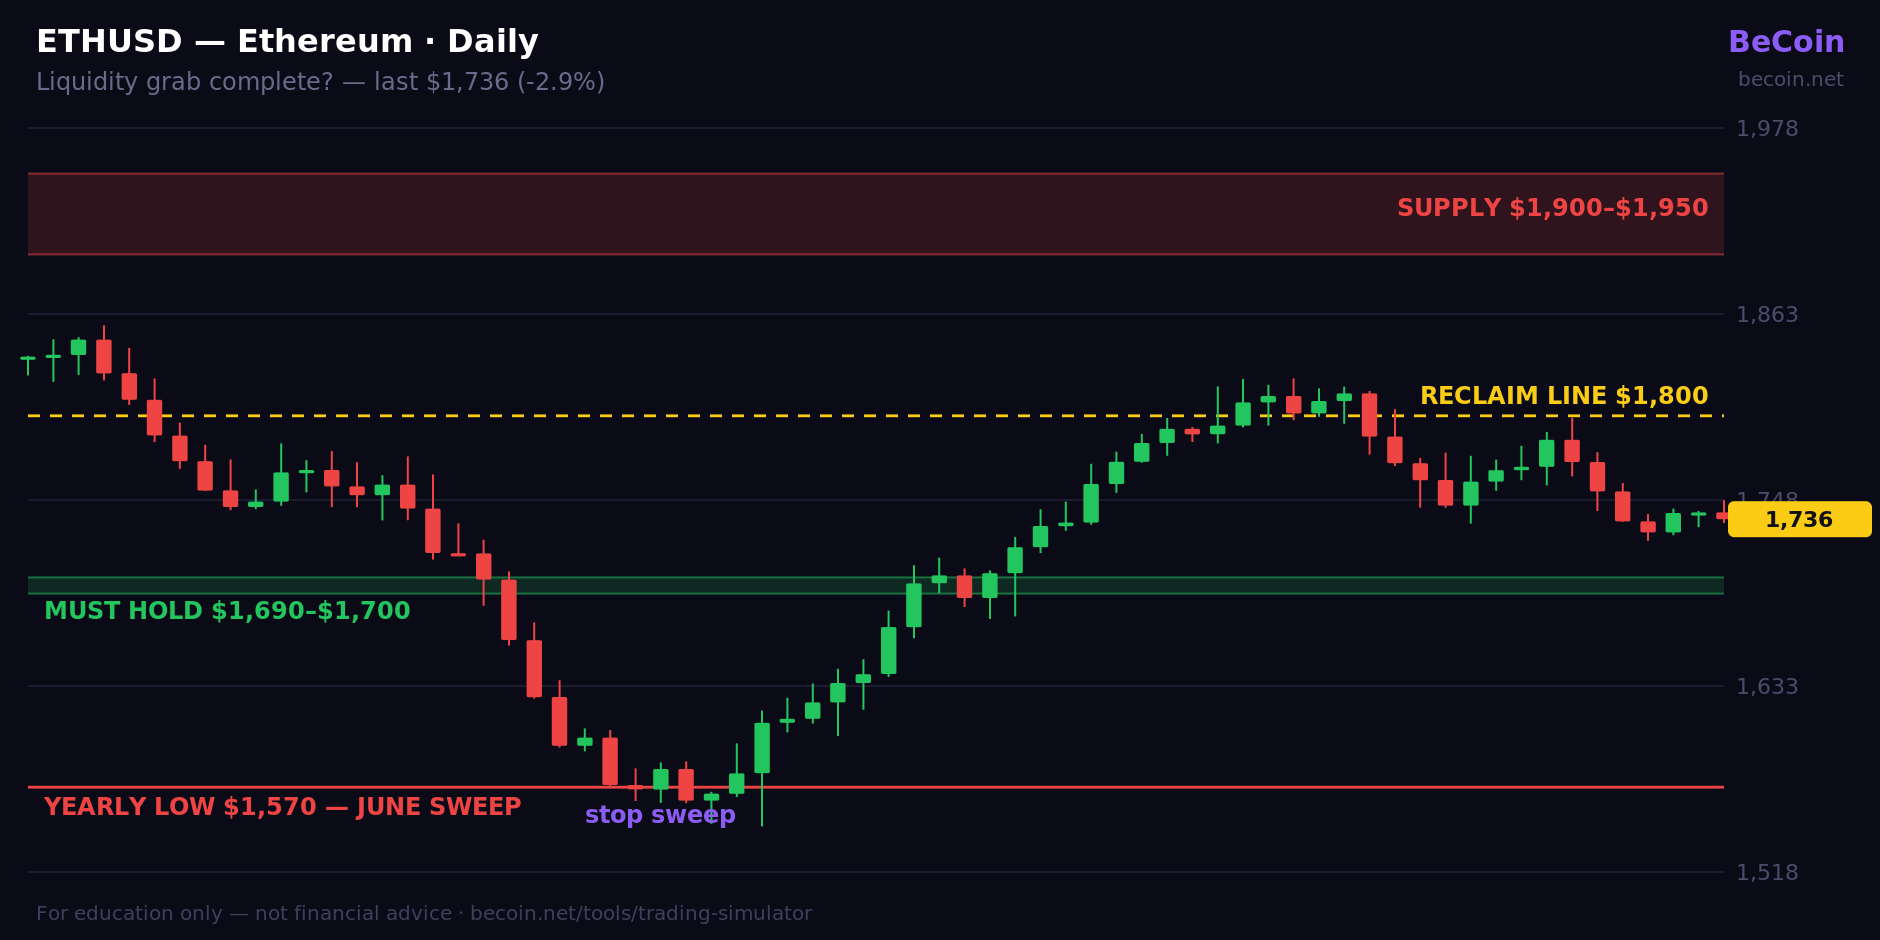
Ethereum at $1,737: was that the liquidity grab, or is the yearly low next?
ETH slipped 2.9% to $1,737, back toward the zone smart-money traders call a completed liquidity grab above the $1,570 yearly low. BeCoin's model makes $1,690–$1,700 the line: hold it and the reclaim of $1,800 is the trade; lose it and the low gets retested.
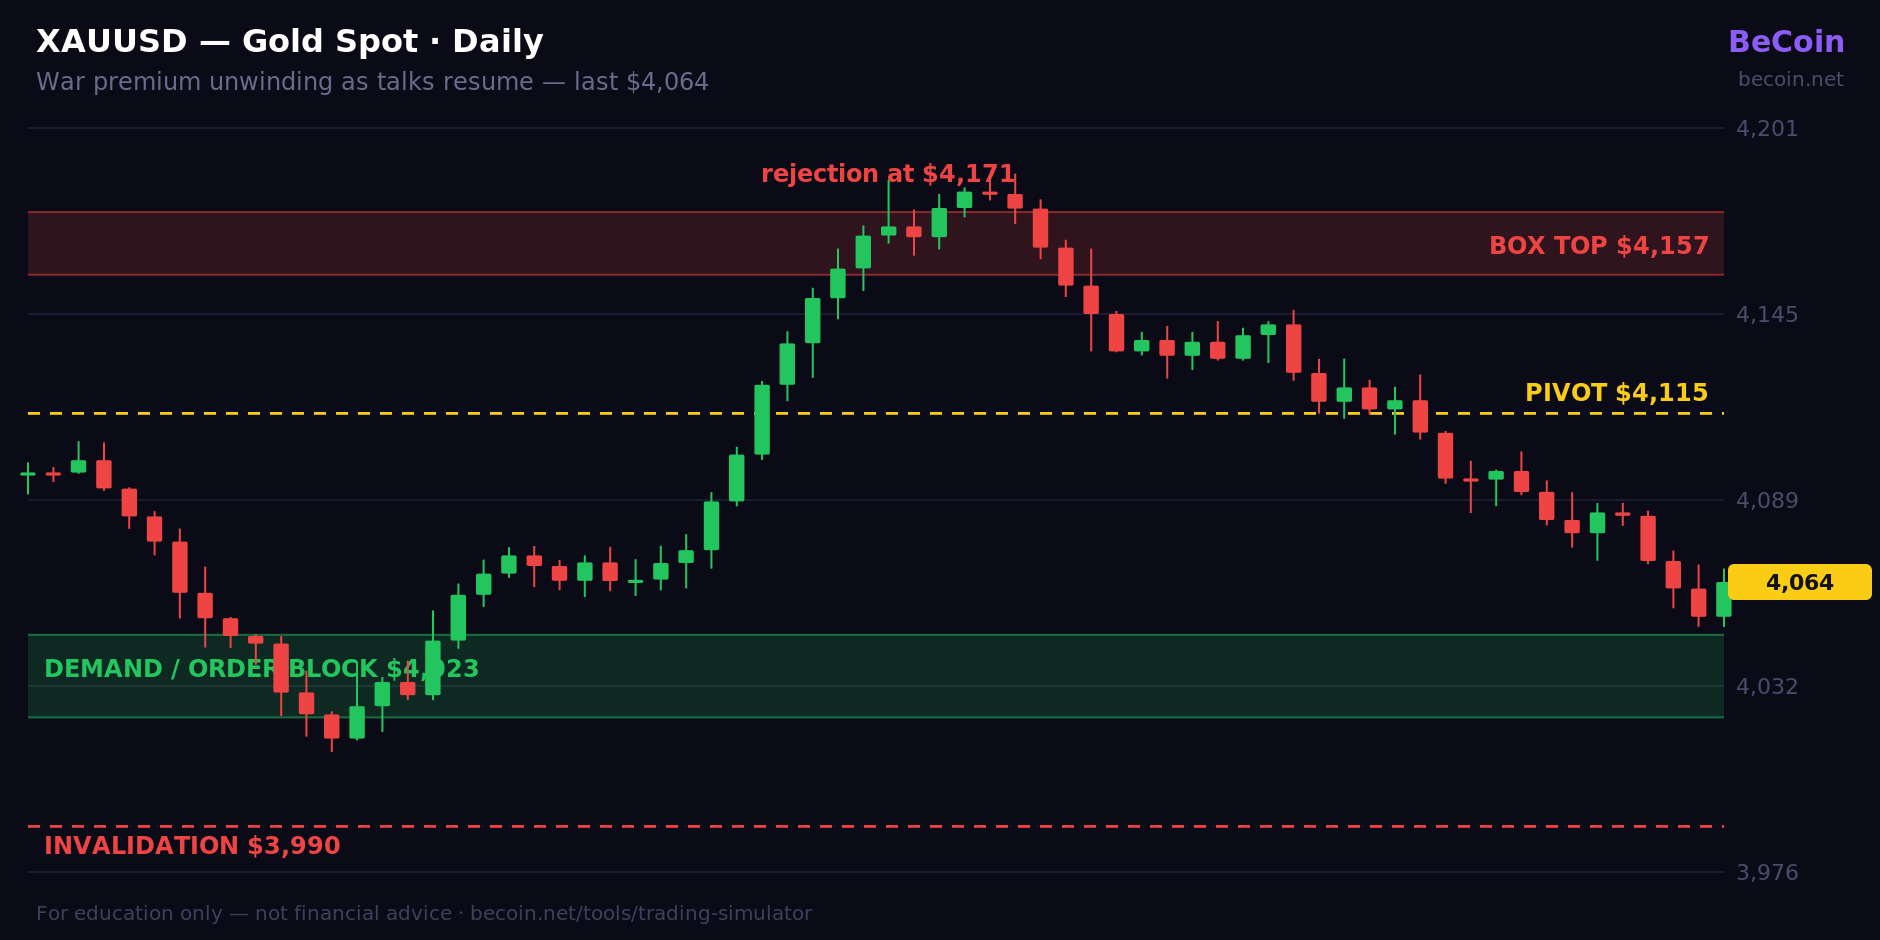
Gold slips to $4,064 as US–Iran talks resume — the $4,023 line decides what's next
Gold fell 1.4% to $4,064 as US–Iran negotiations resumed despite the Strait of Hormuz escalation, unwinding part of the war premium. The $4,023 order block is the level bulls must hold; BeCoin's model keeps the range read until $4,157 breaks.
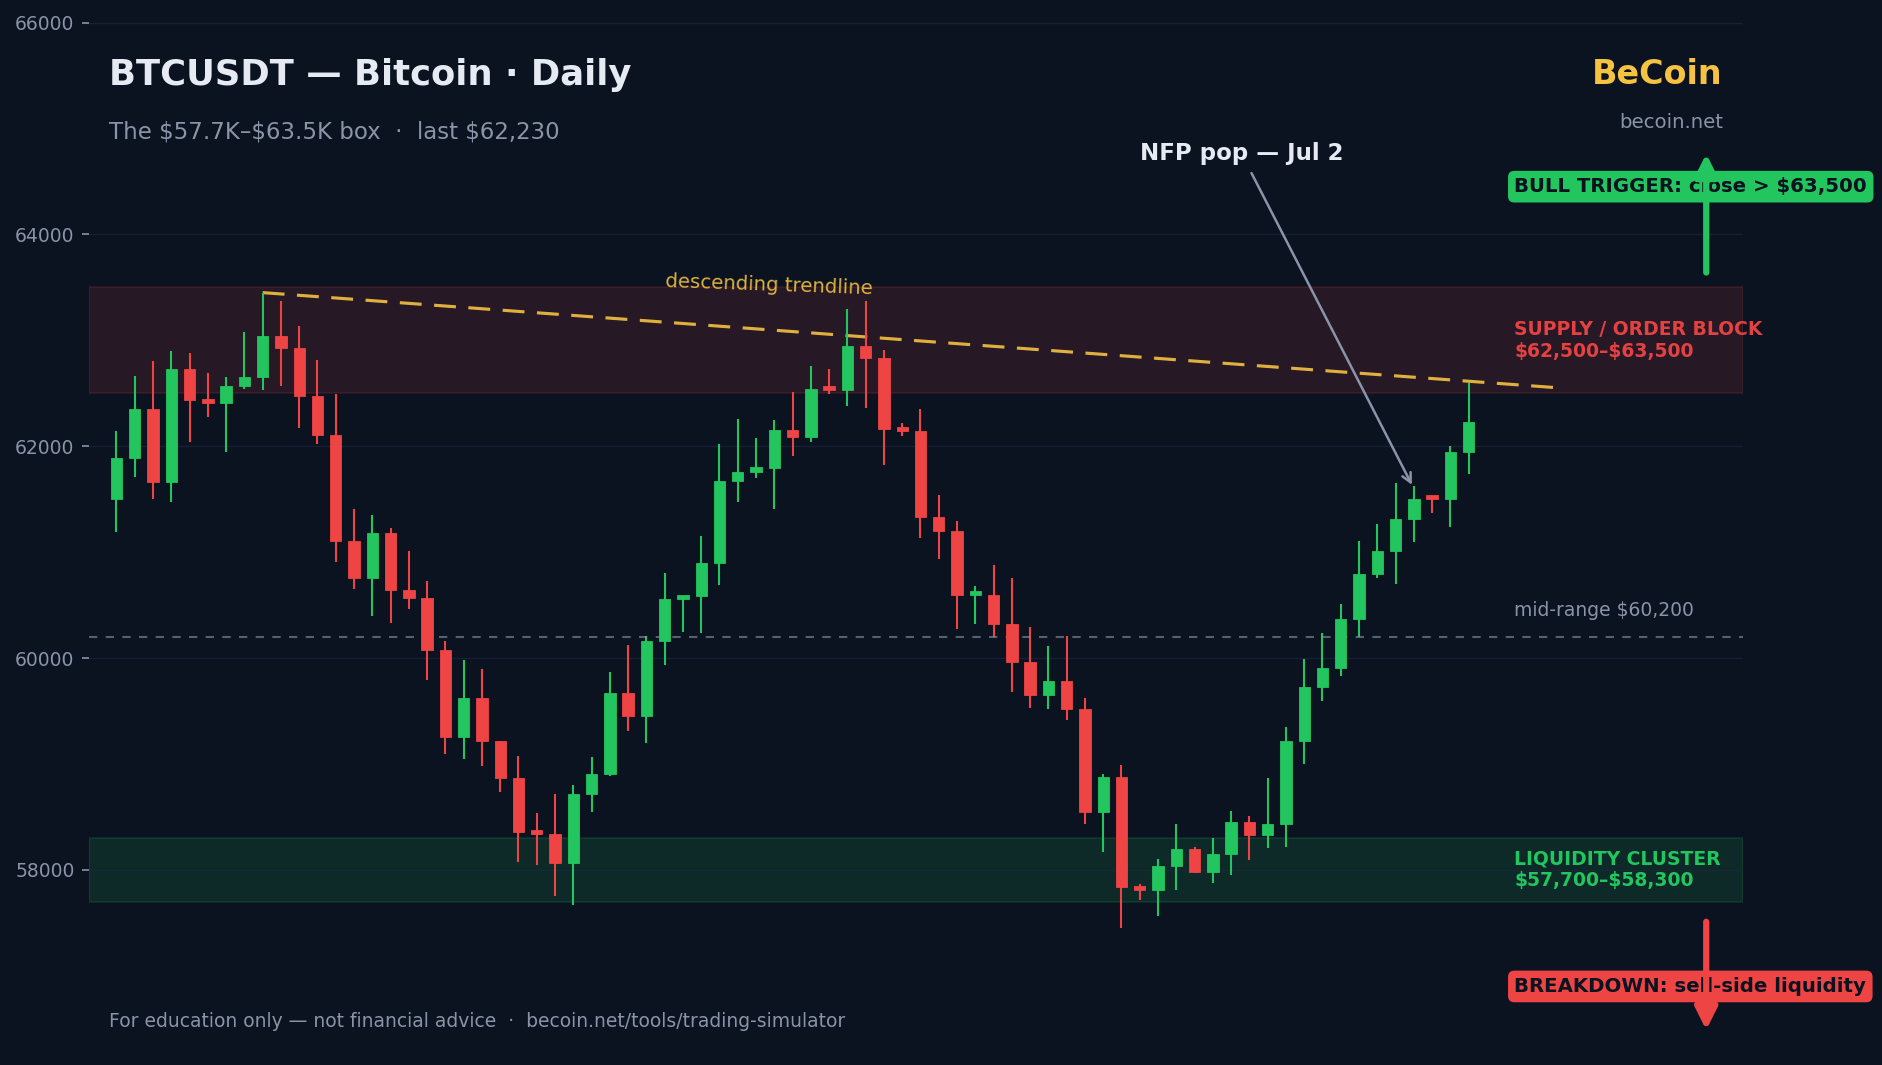
Bitcoin's $6,000 Box: The Levels Both Bulls and Bears Are Watching
Bitcoin is trading near $62K inside a $6,000 range both sides are watching. We break down the supply zone, the liquidity cluster below, both scenarios, and what confirms a real breakout.