Bitcoin H4 Idea: $62,742 Support vs. the $64,418 Reclaim
BTC/USDT: The $64,418 Reclaim Failed — Now $62,317 Is the Level That Matters
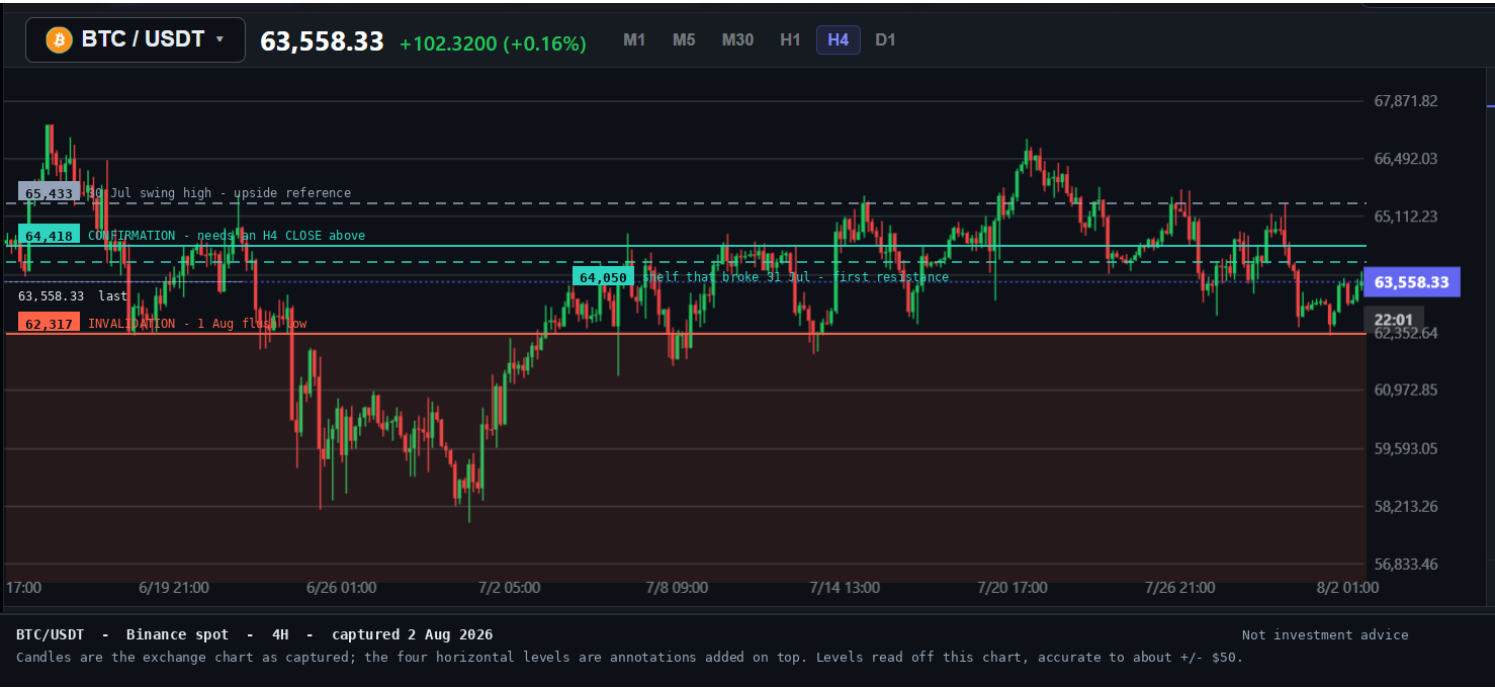
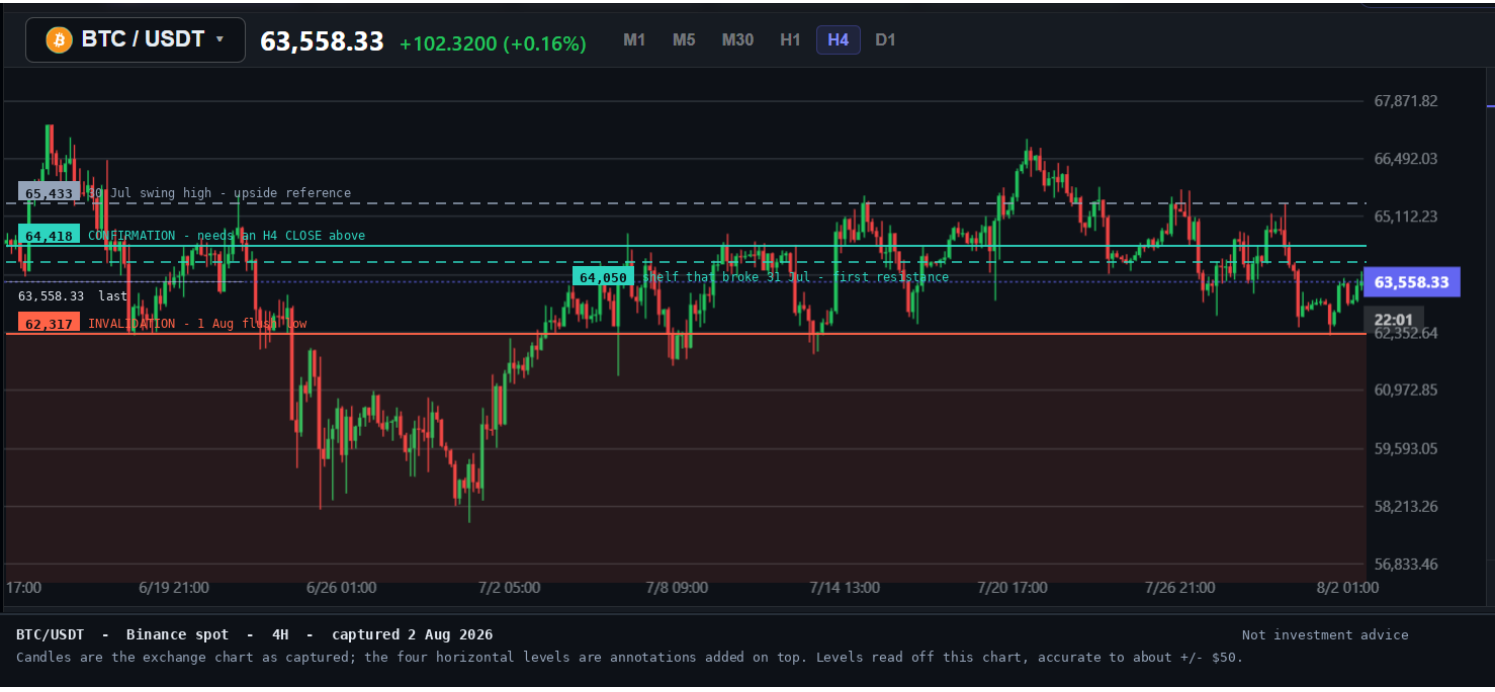
Updated 2 August 2026. BTC/USDT is at $63,558.33 on the 4-hour chart, up 0.16% on the session. This replaces the 28 July note, whose setup was invalidated on 1 August.
What changed since the last update
The 28 July setup asked one question: could an H4 candle reclaim $64,418 without immediately losing it? It never got the chance. Price failed at $65,433 on 30 July, then broke straight down through the stated support.
The invalidation triggered as written. The H4 candle closing around 31 July 06:00 UTC printed a close near $62,750, and the 1 August 09:00 UTC candle closed near $62,317 — a confirmed close below the $62,742 support. The idea was wrong, and it said in advance what would prove it wrong. That is the setup working correctly, not failing.
Nothing about the last update should have been held onto after that close. The correct response was to stand down and re-mark the chart, which is what this note does.
The setup
| Evidence field | Verified value |
|---|---|
| Symbol | BTC/USDT |
| Venue / data source | Binance spot (chart capture) |
| Timeframe | 4-hour |
| Data timestamp | 2 August 2026, ~13:00 UTC (last plotted H4 candle) |
| Current reference | $63,558.33 |
| Support / invalidation | $62,317 |
| First resistance | $64,050 |
| Confirmation | $64,418 |
| Upside reference | $65,433 |
| Chart pattern | failed reclaim, then range-building above the flush low |
| Market context | first full session after the 29 July FOMC hold; 5-day range $62,317–$65,433 |
Why these levels
$62,317 is the 1 August flush low and the lowest H4 close on the chart. It is now the floor the whole structure rests on. It is also the level that broke the last setup, which makes it the natural line to be wrong against.
$64,050 is the shelf price traded on for three sessions before the 31 July breakdown. Broken support tends to act as the first thing sellers defend.
$64,418 stays the confirmation level. It was the top of the range that failed on 27 July and it capped the 29 July bounce almost to the dollar. Until an H4 candle closes above it, every rally is a lower high.
$65,433 is the 30 July swing high and the only reference above the confirmation level worth naming yet.
The bullish path
Price has to hold $62,317 and then close an H4 candle above $64,418. That is roughly 1.4% away, and the $64,050 shelf sits in between — expect it to matter. If $64,418 is reclaimed and held, $65,433 becomes the next conditional reference. A wick through either level without a close is not confirmation, and the last three sessions have produced several of exactly that.
The bearish path
A confirmed H4 close below $62,317 invalidates this note the same way the last one was invalidated. The correct response then is to reassess, not to widen the stop. A rally that stalls under the $64,050 shelf is the earlier warning: it would mean the reclaim attempt has no follow-through, and the range is more likely to resolve downward.
Market context
The Federal Reserve held the funds rate at 3.50%–3.75% on 29 July, its fifth consecutive hold, on a 9–3 vote with three regional presidents dissenting in favour of a hike. Markets are now pricing rate increases rather than cuts for the remainder of 2026. Bitcoin's slide from roughly $65,400 to $62,300 across 30 July–1 August tracked that repricing.
The next scheduled catalysts are Jackson Hole in late August and the 15–16 September FOMC. Between now and then there is no obvious macro event to force a resolution, which is one argument for the range holding.
Execution and risk checklist
- Wait for the stated candle close. An intrabar print through a level is not confirmation.
- Size the position from the distance to $62,317, not from how convinced you are.
- Re-check the live quote and the spread before acting. The levels here are read off a chart capture and are accurate to about ±$50.
- If the first objective is reached, reassess the structure rather than assuming continuation.
- If the required stop makes the reward-to-risk unattractive, skip it. There is no obligation to trade a range.
Chart provenance
The image is the Binance BTC/USDT 4-hour chart as captured on 2 August 2026, with four horizontal decision levels drawn on top as annotations. The candles are the exchange's own; the lines are the only thing added. Level prices were read from the chart's price axis and are approximate to roughly ±$50 — confirm exact OHLC against Binance before acting on them.
Not investment advice. Levels are a framework for making an idea falsifiable, not a forecast.
Methodology and sources
The reference, candle structure and levels were checked once before writing and will be checked again at the approval boundary. Support and resistance are BeCoin’s chart-derived analytical levels, not third-party price targets. Source timestamps and market-session labels are preserved so a reader can distinguish a regular close, delayed quote or live market.
Primary market reference · ·· Related BeCoin market page · Risk-reward calculator
This content is for education only and is not financial advice.

How Liquidity Affects Binary Options Results
When I first started trading binary options, I believed success was all about finding the perfect indicator. I spent weeks testing moving averages, RSI settings, support and resistance levels, and dozens of YouTube strategies that promised easy wins. Some worked for a few trades, but most failed. What confused me was that the same setup […]

WTI reaches $89.43 as Brent clears $95 on renewed supply risk
WTI traded near $89.43 while Brent moved above $95 as Middle East shipping risk lifted crude for a fifth session. Key levels, catalysts and invalidation.

Bitcoin slips to $65,741 as oil and yields test the breakout
Bitcoin is near $65,741 as rising oil and Treasury yields test the $65.7K breakout floor. Here are the levels that confirm or invalidate the move.

Trading Currency Strength Instead of Single Pairs
It was a Tuesday afternoon when I realized I was fighting a losing battle against a ghost. My screen was a chaotic web of indicators. I had the EUR/USD chart open, a moving average crossing over here, a relative strength index flashing oversold there, and a price action setup that looked textbook perfect. I clicked […]

How Many People Own Bitcoin? (2026 Data, Charts & Country Breakdown)
About 365 million people owned Bitcoin in 2025 - roughly 4-4.5% of the world and nearly half of all crypto owners. See the year-by-year growth curve, country data, whole-coin rarity, and why estimates disagree.

IQ Option vs Deriv Chart Comparison
The Night I Realized My Charts Were Lying to Me It was three in the morning, the exact hour when the market looks either like a goldmine or a psychological hazard. I was sitting in front of two monitors, a lukewarm mug of coffee in hand, watching a critical support level on EUR/USD. On my […]