AVGO Stock Forecast: Broadcom Defends $392 Before 2 September
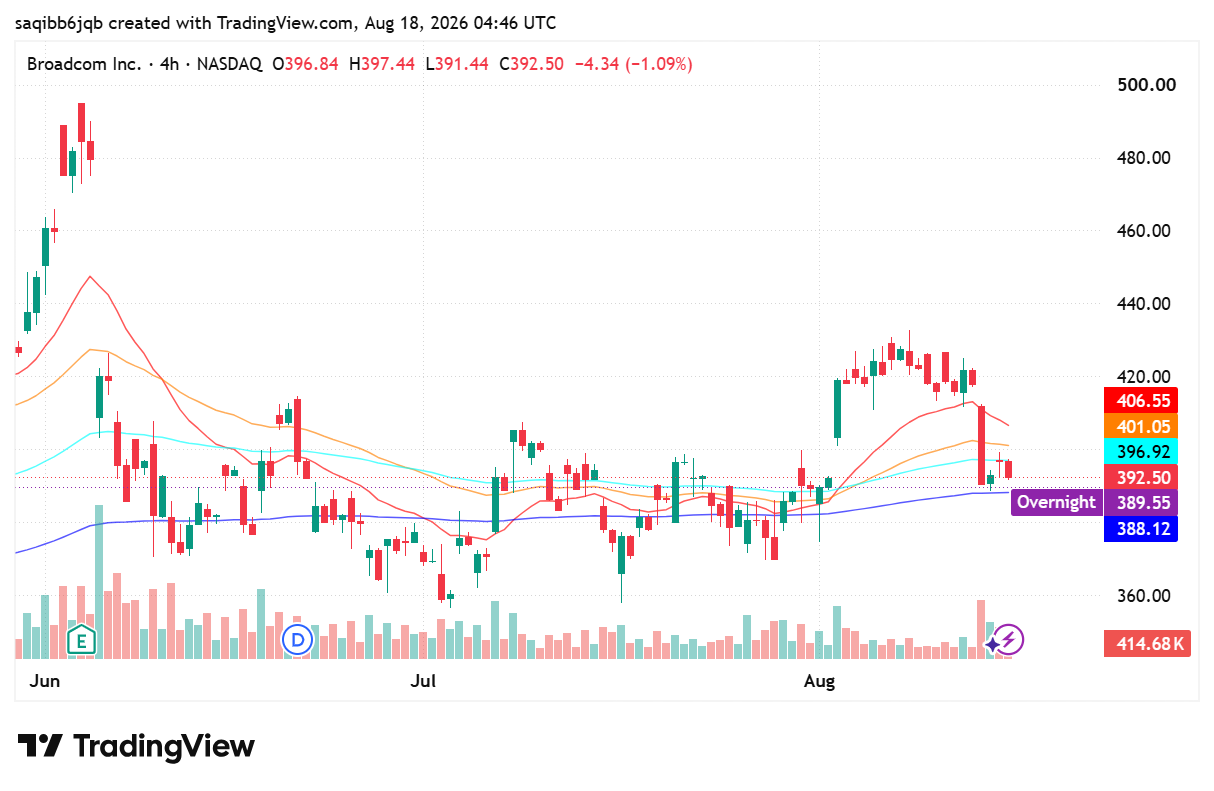
- The shares trade at $392.43, down 0.14% and sitting directly on the 200-period average.
- Third quarter results land on 2 September with revenue guided to roughly $29.4bn and AI revenue to $16bn.
- The $388 long-term average is the level that has held every August pullback so far.
Fundamental Analysis: AVGO
Fiscal second quarter results on 3 June showed revenue of $22.19bn, up 48% year on year, with artificial intelligence semiconductor revenue of $10.8bn growing 143%. Adjusted EBITDA reached $15.24bn, or 69% of revenue, and non-GAAP diluted earnings were $2.44 a share. The guidance was the more striking part: roughly $29.4bn of revenue for the third quarter, up 84%, with AI revenue expected to more than triple to $16bn.
That guidance is also the risk. A company growing consolidated revenue 84% year on year has left itself no room to disappoint, and the custom accelerator business driving it is concentrated in a small number of hyperscale customers. Third quarter results are scheduled for 2 September, which puts a hard catalyst two weeks out and explains why the stock has been unwilling to commit in either direction this month.
The share price has already been through one repricing this year, falling from roughly $480 in early June to a low near $355 in early July before rebuilding. What it has not yet done is reclaim that June high, and it will not until the September print either validates the AI ramp or shows it decelerating.
Technical Analysis: AVGO
The 4-hour chart shows the June top near $480 giving way to a July base between roughly $355 and $400, followed by an August rally that peaked around $428 on 12 August. That advance was undone in a single sharp session on 15 August, which returned price to $392 and pushed it back beneath the 20-, 50- and 100-period averages now stacked overhead at $406.55, $401.05 and $396.92.
Resistance runs in three steps: $396.92, $401.05 and $406.55, with $428 above them as the August high. Support is the 200-period average at $388.12, which has caught every pullback this month, and then $375 inside the July base. A four-hour close below $388 would break that pattern and expose the lower half of the July range before results.

Can You Start Trading with $10 on Deriv?
A lot of beginners enter trading with the same question: “Is $10 actually enough to start trading on Deriv?” The short answer is yes. But the real answer is more complicated. You can start with $10 on Deriv, but whether you can survive, learn, and grow that account depends entirely on your expectations, discipline, and […]

Which Broker Has Faster Withdrawals? Real 2026 Comparison for Traders
When most beginners choose a broker, they focus on bonuses, signals, or flashy interfaces. But after trading for a while, you realize one thing matters more than almost anything else: How fast can you actually withdraw your money? A broker can look perfect until your first withdrawal request gets stuck in “processing” for three days. […]

Deriv vs Binomo for Low-Risk Trading in 2026: Which Platform Is Better for Safer Growth?
Most beginners enter trading with one simple goal: avoid blowing up their account in the first week. That is exactly why low-risk trading matters more than fast profits. Two platforms that constantly appear in beginner discussions are Deriv and Binomo. Both allow small deposits, short-term trading, and beginner-friendly access. But when your focus is protecting […]

Which Is Easier for Beginners: Binomo or IQ Option?
For most beginners, the hardest part of trading is not strategy. It is surviving the first few months without blowing the account from emotional decisions, overtrading, and poor risk management. That is why choosing the right platform matters more than many new traders realize. Two names dominate beginner conversations in binary and short-term trading: Binomo […]

I Started with $10 on Quotex – Day 1 Results (Real Case Study)
Most beginner traders ask the same question:Can you actually grow a small account like $10? Instead of theory, I decided to test it in real conditions. This is a Day 1 case study of trading with $10 on Quotex, documenting everything from setup to execution, mistakes, emotions, and actual results. No hype, no fake screenshots, […]

Simple Daily Trading Routine for Consistency
Most traders do not fail because of strategy alone. They fail because they are random. They trade when emotional, skip planning, increase risk after losses, and ignore review sessions. Consistency in trading usually comes from routine more than prediction. A simple daily trading routine helps you stay disciplined, reduce emotional mistakes, and improve decision making […]