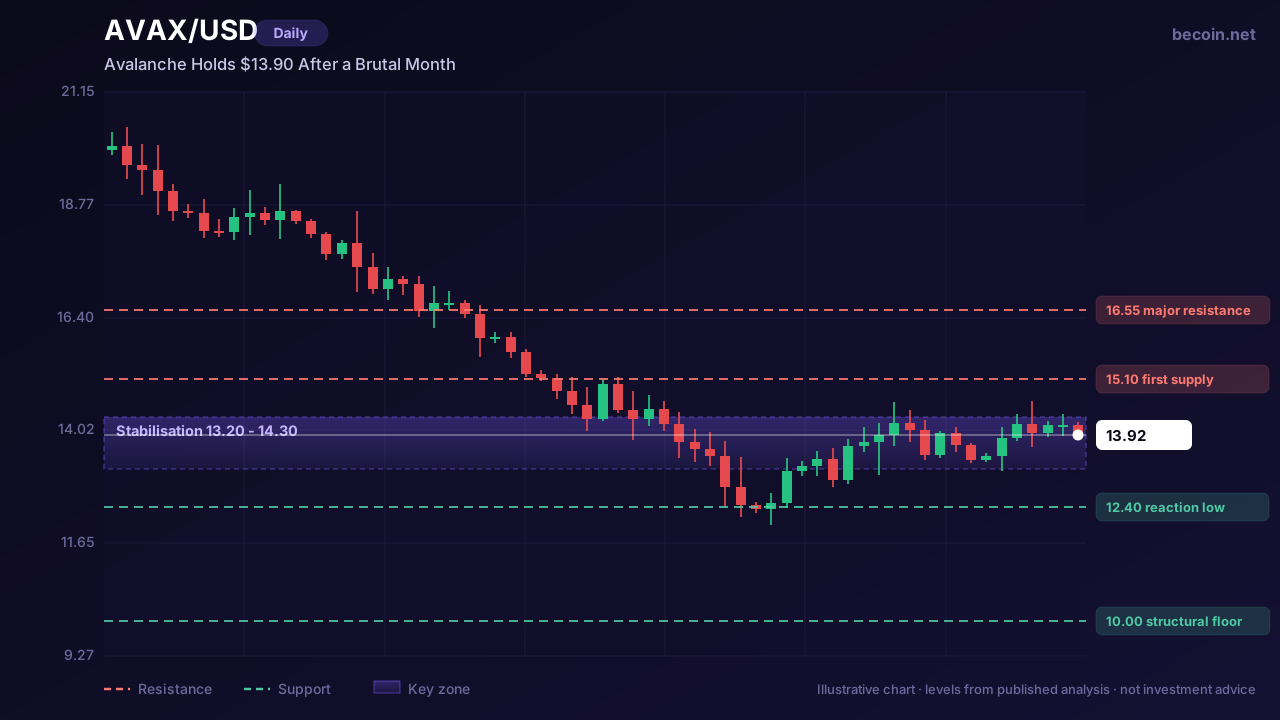
Avalanche Holds $13.90 After a Brutal Month — $16.55 Is the Level That Matters
Avalanche trades near $13.92, roughly flat on the day, down about 4% on the week and close to 30% lower than it was a month ago. That is a serious drawdown, and it has left the token sitting in a narrow band while the market decides whether the selling is finished.
The floor that has done the work
For most of this cycle, the $10 area has been the structure that mattered for AVAX. It is where accumulation has repeatedly shown up, where long-horizon buyers have been visible, and where every serious decline has eventually found a bid. Price has not been tested down there recently, which is worth noting — the current stabilisation is happening well above the floor, not at it.
That is a mildly constructive detail. Assets that bottom above their last major support are usually finding buyers earlier than they did previously, which is the sort of thing that shows up before a base is obvious. It is not a signal on its own, but it changes the character of the pullback from capitulation to digestion.
Supply is the part traders keep ignoring
The chart is only half the picture on AVAX. Scheduled token unlocks continue to release meaningful quantities into a market that has not been absorbing them easily, and unlock-driven supply is one of the few genuinely predictable headwinds in crypto. It does not necessarily send price lower on the day — the market often front-runs it — but it does cap how quickly a recovery can build, because every rally has to clear inventory that arrives on a calendar rather than on a catalyst. Our Becoin.net Premium Forecast follows this token through each of those levels as the range resolves.
Traders who model AVAX purely on price structure tend to be surprised by how heavy the rallies feel. The unlock schedule is usually the missing variable.
The level the Avalanche recovery has to clear
Overhead, the number that keeps coming up is around $16.55. It is where the last real distribution happened, it lines up with the failed rally attempts earlier in the decline, and it is the top of the range that price has been trapped beneath. Everything between here and there is chop; everything above it is a different chart.
Before that, $15.10 is the first friction — a level worth watching mainly for how price behaves when it arrives. A clean push through with follow-through says demand is genuine. A grind up followed by a stall says the unlock supply is still doing its job.
What would break the setup
The bearish structure is not resolved. Price is still below its major moving averages, the descending structure from the highs has not been invalidated, and momentum has only stopped falling rather than turned. A close back below the $12.40 reaction low would say the stabilisation failed, and from there the $10 floor becomes the obvious destination rather than a distant reference.
The honest framing is that AVAX is currently a range asset with a bearish higher timeframe and a stabilising lower timeframe. That combination generates a lot of trades and very few good ones. The setups worth taking are at the edges — near the floor with a defined stop, or above $16.55 once the level has actually been reclaimed — not in the middle where the story is loudest and the risk-reward is worst.
The longer view
There is a credible longer-horizon argument for Avalanche built on network activity and institutional interest, and plenty of analysts frame the current zone as the discount phase of a multi-year structure. That may well prove right. But a thesis measured in years does not tell you anything useful about the next month, and conflating the two is how traders end up holding a position sized for a swing trade through a drawdown sized for an investment.
Access levels for the daily level maps, scenario updates and alerts are set out on Becoin.net Tariff Plans.
This is market analysis for educational purposes and is not investment advice. Crypto assets are volatile and trading carries risk of loss.

Which Broker Has Faster Withdrawals? Real 2026 Comparison for Traders
When most beginners choose a broker, they focus on bonuses, signals, or flashy interfaces. But after trading for a while, you realize one thing matters more than almost anything else: How fast can you actually withdraw your money? A broker can look perfect until your first withdrawal request gets stuck in “processing” for three days. […]

$10 to $50 Trading Challenge – Strategy + Real Results (Case Study)
Turning $10 into $50 sounds easy until you actually try it. Small accounts expose every weakness in your trading. One bad decision can erase hours of progress, and emotional trading becomes much harder to control when every dollar matters. This case study breaks down how a $10 account was realistically grown to $50 using a […]

Why Traders Move from Binomo to Deriv in 2026: The Real Reasons Behind the Switch
If you spend enough time around trading communities, you’ll notice a pattern. Many traders start with Binomo. Then, after a few months, a surprising number begin looking at Deriv. Some switch completely. Others keep both accounts but gradually move most of their trading activity to Deriv. I noticed this trend while talking to beginner traders […]

Which Broker Has the Cleanest Interface? Real Comparison for Beginners in 2026
Looking for the cleanest trading interface in 2026? Compare Binomo, IQ Option, Quotex, Deriv, and more based on speed, layout, usability, mobile experience, and beginner friendliness. When most beginners choose a broker, they focus on bonuses, payouts, or deposit methods. But after testing multiple platforms for months, I realized something surprising: A messy interface can […]

Binomo vs IQ Option Withdrawal Speed: Full 2026 Comparison Guide
Withdrawal speed is one of the most important factors for traders, especially beginners who want quick access to profits. A platform may look good for trading, but if getting your money takes too long, frustration builds fast. In this detailed comparison of Binomo and IQ Option, we will break down real withdrawal timelines, processing behavior, […]

Why 90% of Traders Lose Money (Real Reasons Beginners Don’t Realize)
Most Traders Don’t Lose Because of Strategy — They Lose Because of Behavior If you ask most beginners why traders fail, you’ll hear answers like: But after observing thousands of beginner trading behaviors, the truth is much simpler and more uncomfortable: “Most traders lose money because of how they behave, not what they use.” Even […]