AUD/JPY Runs Into the 0.786 Retracement: The Carry Trade's Nervous Moment
A pair that tells you how the world feels
AUD/JPY is not just a currency cross. It is a mood ring. The Australian dollar is levered to global growth and commodity demand, the yen is the market's default hiding place, and the spread between the two moves with risk appetite far more reliably than most sentiment surveys. When this pair rolls over, it usually means something.
Right now it has bounced hard off the lows and pushed back into a zone that a lot of chartists were waiting for.
Where AUD/JPY actually is
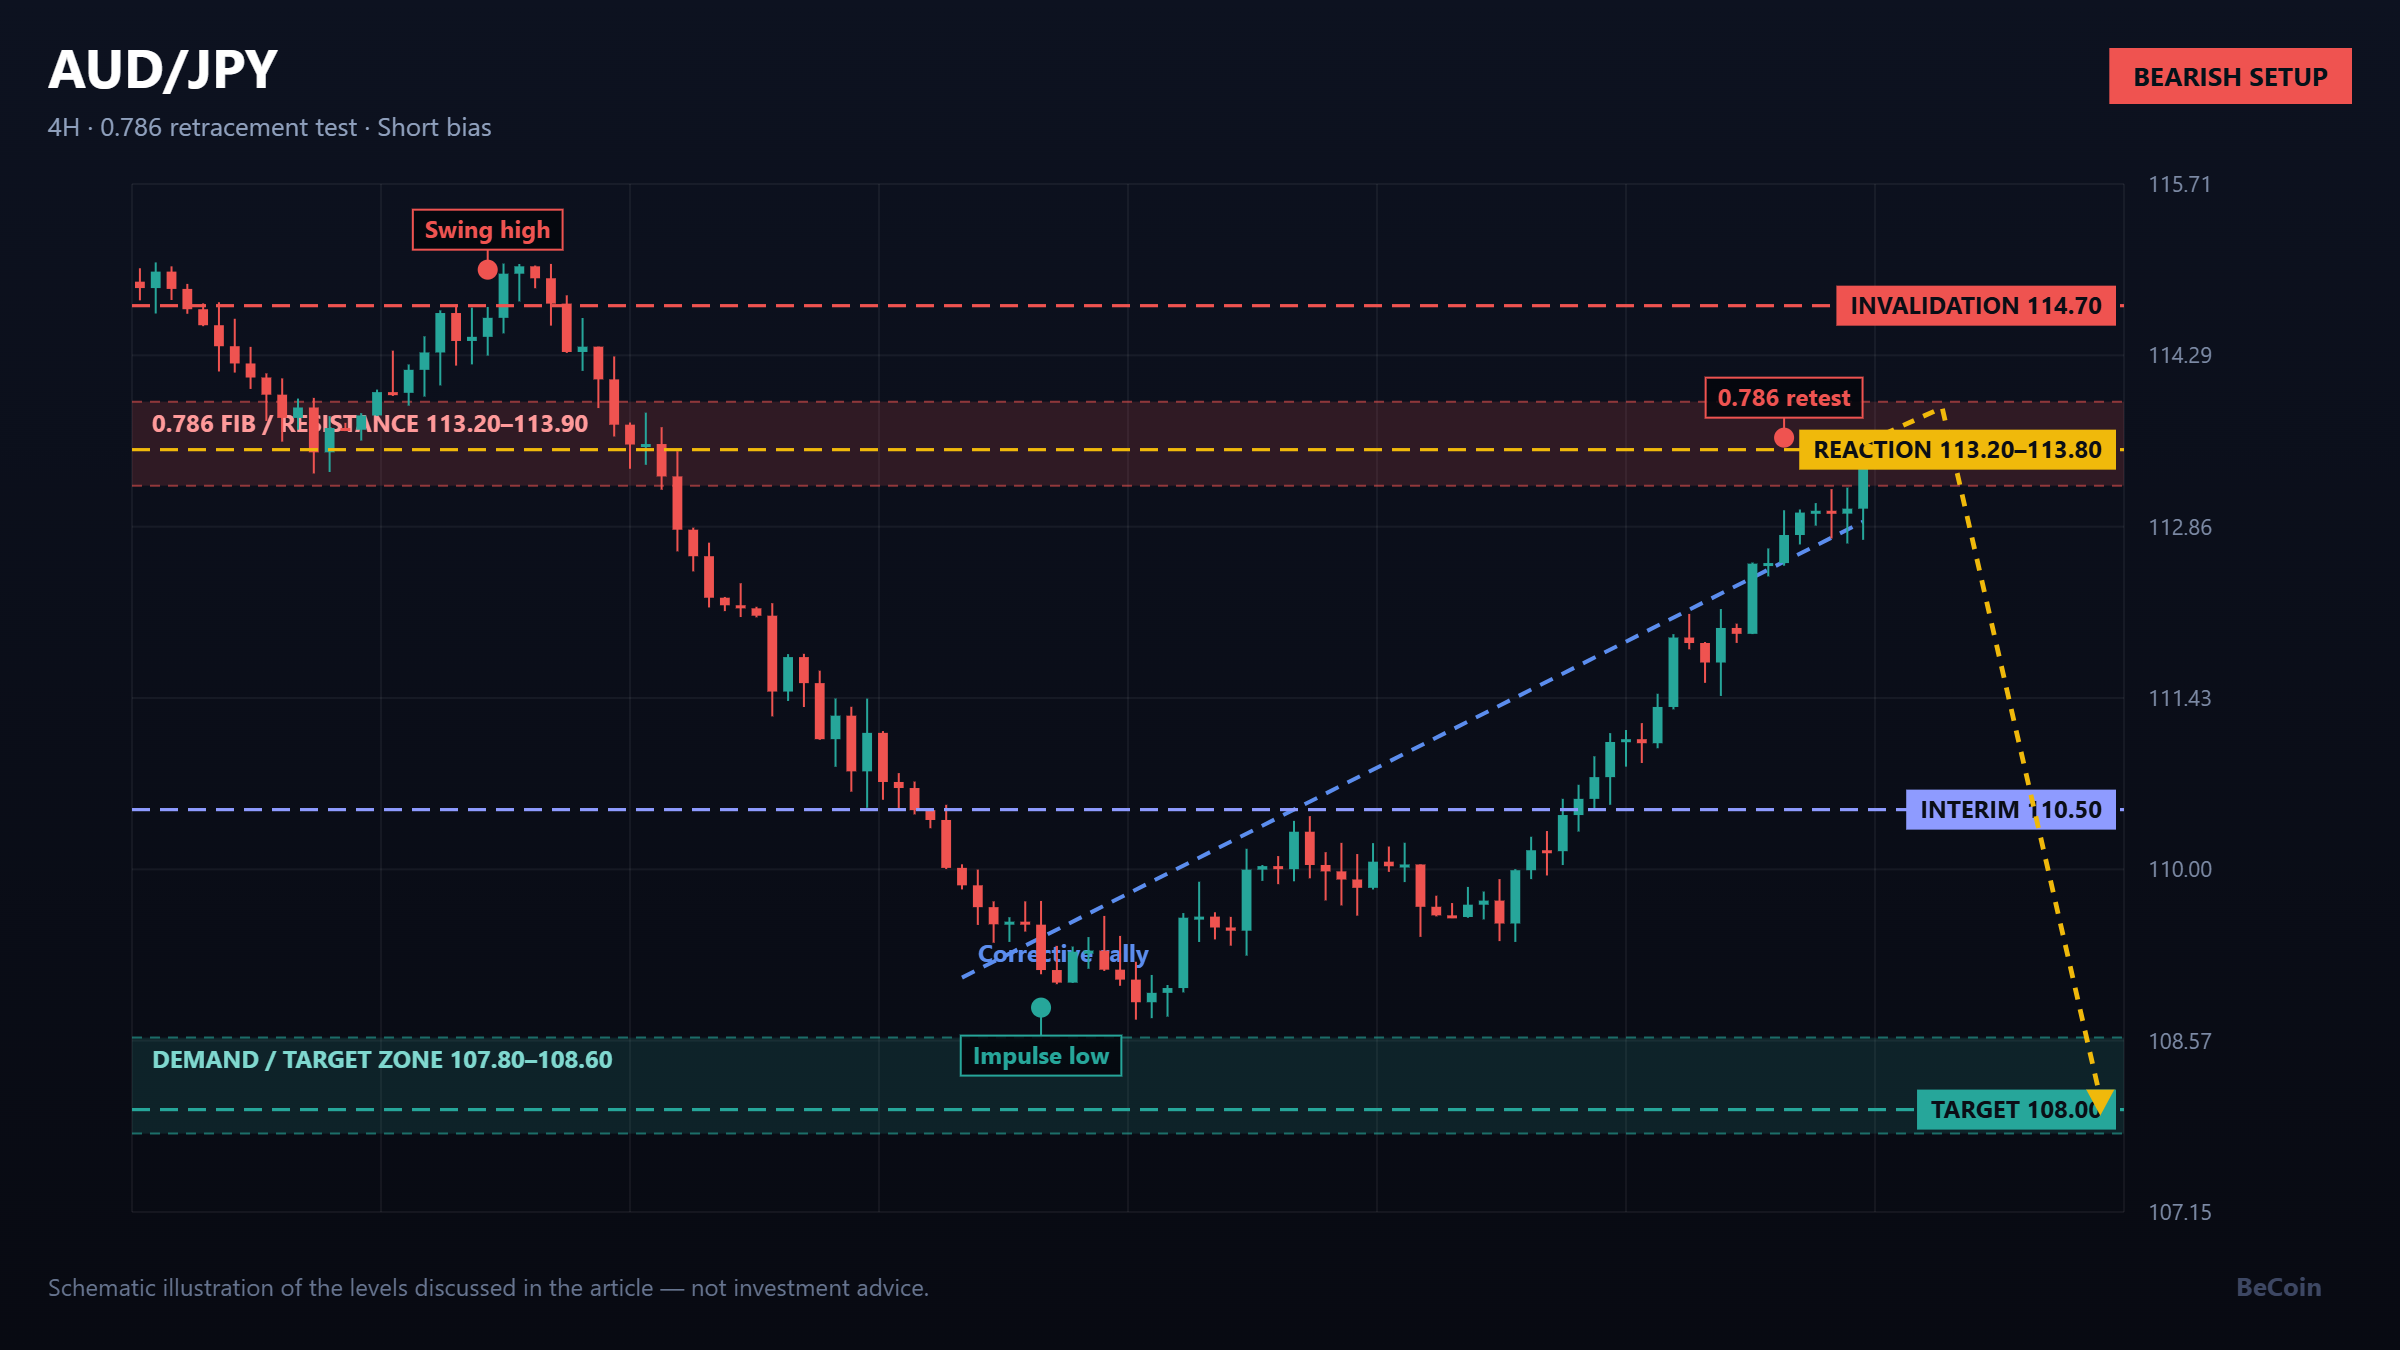
The four-hour chart shows a sharp decline from the highs near 115.00 into a low around 108.80, followed by a recovery that has retraced roughly three quarters of that move. The 0.786 Fibonacci retracement sits in the 113.20 to 113.80 area, and price has now traded into it.
The 0.786 has a particular reputation. It is deep enough that the original impulse still looks intact if the market rejects there, and shallow enough that a break through it usually means the impulse is finished. That makes this a genuinely binary zone rather than a vague area of interest.
The structure underneath
What supports a bearish reading is that the recovery has been corrective in character. The advance has been choppy and overlapping rather than impulsive, with several deep pullbacks along the way. Corrective rallies into deep retracements are the textbook setup for continuation, not reversal.
The counterargument is equally simple. The pair has not yet made a lower high on the higher timeframe since the bounce, and a decisive four-hour close above 114.70 would leave the bearish case with very little to stand on.
The levels that matter
The reaction band runs from 113.20 to 113.80, anchored by the 0.786 retracement. Invalidation sits above 114.70, where the retracement is effectively complete and the prior swing high comes back into play. On the downside, the first shelf is around 110.50, with the more substantial demand area between 107.80 and 108.60. A full retracement of the bounce puts 108.00 in reach.
The risk-to-reward from the reaction zone to 108.00 is what makes this setup worth watching at all. Without that asymmetry, fading a strong bounce into resistance is just stubbornness.
What could break the chart
Two things. The Bank of Japan remains the single largest source of gap risk in any yen cross, and any shift in tone on policy normalisation can move this pair further in an hour than in the preceding month. Second, Australian data and Chinese growth headlines feed directly into the Aussie leg. A strong risk-on session in equities tends to drag AUD/JPY higher regardless of what the Fibonacci levels say.
How to approach it
The sensible version of this trade is reactive. Let price enter the zone, wait for rejection to appear in the candles, and define risk above 114.70 rather than guessing. If the pair simply consolidates inside the zone without rejecting, that is a warning sign in itself. Markets that refuse to fall from resistance often end up going through it.
Bottom line
AUD/JPY is testing the deepest retracement that still keeps the bearish structure alive. Rejection from 113.20 to 113.80 opens a path back toward 110.50 and eventually 108.00. Acceptance above 114.70 hands the initiative back to buyers and puts the risk-on narrative firmly back in charge.
Becoin.net Premium Forecast - Becoin.net Tariff Plans
This article is educational market commentary and is not investment advice. Trade your own plan and manage risk accordingly.

Which Broker Has Better Risk Management Tools?
The burning smell of my own account blowing up is a scent I will never forget. It was a rainy Tuesday afternoon a few years back. I sat huddled over my laptop, watching a currency pair oscillate. Confident, arrogant, and entirely unprotected, I clicked buy. Minutes later, a sudden market spike completely wiped out my […]

WTI reaches $89.43 as Brent clears $95 on renewed supply risk
WTI traded near $89.43 while Brent moved above $95 as Middle East shipping risk lifted crude for a fifth session. Key levels, catalysts and invalidation.

Deriv vs Binomo Deposit Methods: My 2026 Real Money Comparison Guide
I sat in the corner of a crowded coffee shop, my eyes fixed on my phone screen. After months of testing strategies on a demo account, I had finally saved up a small pocket of risk capital. I felt ready to trade live. A high-probability setup was forming on my charts, and my heart rate […]

Which Broker Has Faster Withdrawals? Real 2026 Comparison for Traders
When most beginners choose a broker, they focus on bonuses, signals, or flashy interfaces. But after trading for a while, you realize one thing matters more than almost anything else: How fast can you actually withdraw your money? A broker can look perfect until your first withdrawal request gets stuck in “processing” for three days. […]

Best Broker for One Trade a Day Strategy in 2026
Most traders lose money because they trade too much. They enter random setups, chase candles, overreact emotionally, and turn a simple strategy into pure gambling. That is exactly why the one trade a day strategy is becoming more popular among smart traders in 2026. Instead of sitting in front of charts all day, this approach […]

Simple Daily Trading Routine for Consistency
Most traders do not fail because of strategy alone. They fail because they are random. They trade when emotional, skip planning, increase risk after losses, and ignore review sessions. Consistency in trading usually comes from routine more than prediction. A simple daily trading routine helps you stay disciplined, reduce emotional mistakes, and improve decision making […]