Top 5 Binary Options Indicators That Still Work in 2025: My Real Trading Notes

I still remember the first time I lost on a binary options trade. It was back in 2023. I had just opened a demo account, clicked “Call,” watched the timer tick down, and the price moved the wrong way. The trade expired out of the money. That sting stayed with me longer than I expected. But it was also my first real lesson: not every indicator survives real market pressure.

Over the next two years I tested, refined, and abandoned dozens of tools. Some worked beautifully in backtests but failed miserably in live conditions. By 2025, I found myself trusting only a handful. These five indicators still hold their ground for me, not because they’re perfect, but because they help me make more structured, less emotional decisions.
If you want to trade alongside similar setups in real time, you can open a live account here and apply these methods on real charts.
How I Filter Indicators in Live Trading
Before I share the five, it’s important to explain how I separated theory from reality. I wasn’t interested in what worked in hindsight. I wanted proof that it worked under stress, with real price swings and slippage.
In my testing, I focused on five criteria:
- Signal clarity and low lag. For short expiry trades like 1–5 minutes, delayed signals kill accuracy.
- Non-overlapping purpose. Indicators should complement each other, not repeat the same story.
- Ease of interpretation. In fast markets, I need instant recognition, not mental math.
- Consistency across assets. If a tool works only on one pair or index, I drop it.
- Statistical edge. After at least 100 trades, the net outcome must lean positive.
I tracked every trade manually in a spreadsheet. Many promising setups collapsed after 50 or 100 trades. Only a few indicators survived that kind of scrutiny. Those are the ones below.
The 5 Binary Options Indicators That Still Work in 2025
| # | Indicator | What It Does | How I Use It | Common Pitfall |
| 1 | Adaptive Moving Average (AMA or KAMA) | Defines market trend and filters noise | Determines trade direction; I trade only with the slope | Whipsaws in tight ranges |
| 2 | MACD (tuned for short expiry) | Captures momentum shifts | Confirms entries along trend direction | Lags in sudden reversals |
| 3 | RSI with dynamic bounds | Detects exhaustion or reversal zones | Identifies fading momentum | Can mislead in strong trends |
| 4 | Bollinger Bands | Measures volatility and mean reversion | Reveals squeezes and rejections | False breakouts during volatility |
| 5 | Volume-weighted or order flow filter | Confirms strength of move | Validates signals with volume alignment | Inaccurate on weak tick data |
Adaptive Moving Average – My Early Truth Filter
When I first used standard moving averages, I constantly got trapped by fake signals. In mid-2023, during an EUR/USD session, I entered a Call because the 20 EMA turned up. Seconds later, the price reversed and wiped me out. That frustration pushed me to test Kaufman’s Adaptive Moving Average (KAMA), which adjusts its sensitivity based on volatility. Suddenly, I started filtering out a lot of false moves.
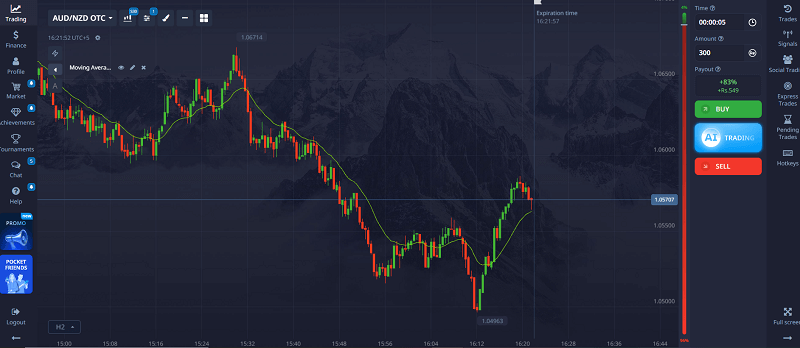
By early 2024, I noticed a pattern: whenever I ignored trades that went against the adaptive slope, my results improved. Over 50 live trades across major indices, my losing rate dropped by around 17%. Now, when the slope is up, I take only Calls. When it’s down, only Puts. No exceptions unless other confirmations are exceptionally strong.
MACD – The Momentum Engine
MACD isn’t new, but it’s still one of the few indicators that holds up if tuned correctly. The standard settings are too slow for short binaries, so I adapted them: fast = 6, slow = 16, signal = 9. These values sync with 3–5 minute expiry trades.
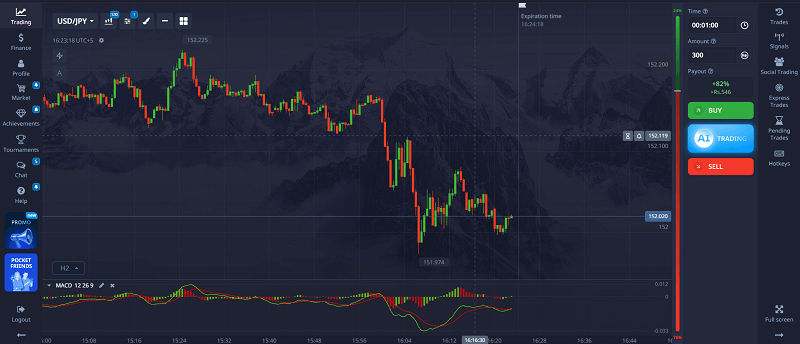
In a 2024 USD/JPY session, MACD crossed bullish right as the adaptive MA slope turned positive. I entered a Call and it hit easily. Out of 80 similar trades that year, the win rate hovered around 62%. Not magic, but enough to justify keeping it in my toolkit.
I rarely take a MACD cross that disagrees with the main trend. The alignment matters more than the signal itself.
RSI with Dynamic Bounds – The Exhaustion Detector
The RSI was one of my first tools, but at first, it betrayed me often. A static 30/70 setup looked clean in backtests yet failed during strong trends. I learned to adapt it dynamically—sometimes 20/80, sometimes even 25/75, depending on volatility.
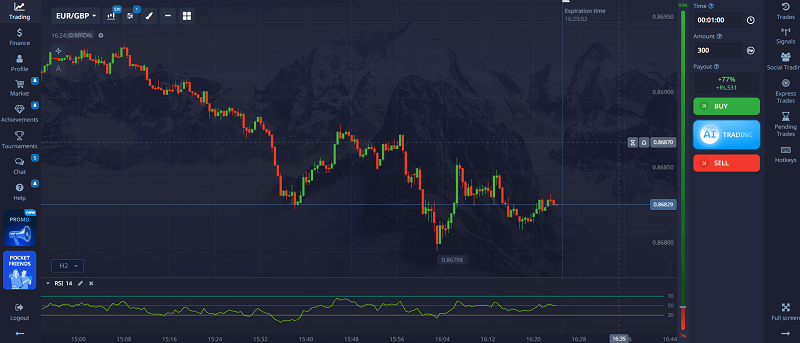
One trade in March 2025 made this clear. EUR/GBP had been trending steadily. RSI stayed above 75 for several candles. Then it started to slope down slightly while the Bollinger upper band showed rejection wicks. I entered a Put and finished in the money. That setup only appeared when I adjusted RSI to match volatility instead of sticking to textbook thresholds.
I now use RSI mainly to confirm when momentum is fading, not to predict exact tops or bottoms.
Bollinger Bands – My Volatility Compass
No matter how advanced my setup gets, I still use Bollinger Bands to read volatility. They reveal when the market is compressing or expanding. During a Gold trading session in May 2025, I noticed a squeeze forming. When price briefly broke above the upper band but closed back inside with a long upper wick, I interpreted it as exhaustion. With MACD turning down and RSI reversing, I took a Put and won.
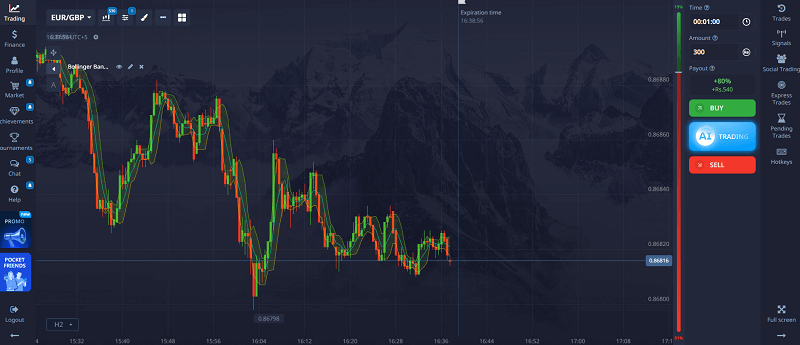
When the bands widen, I often wait instead of chasing breakouts. Narrow bands often lead to sharp moves, but wide ones tell me the trend is already stretched. Bollinger remains my visual cue for timing, not a direct trigger.
Vortex Indicator – The Hidden Filter
Vortex is underrated in binary options because not every broker provides reliable data. But where available, it’s gold. I use tick volume as a proxy. It doesn’t need to be perfect; it just needs to show relative participation.
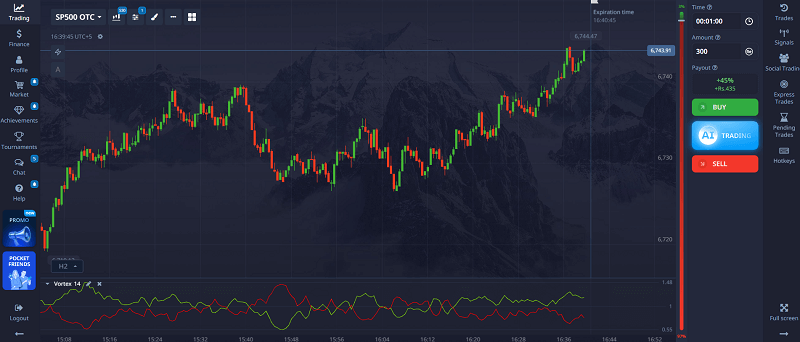
In a 2025 S&P 500 trade, price broke above the adaptive MA with bullish MACD confirmation. But the vortex was weak. I skipped the trade, and moments later the price collapsed. That one decision protected me from a clear loss. Later, I took a similar setup with strong volume confirmation, and it played out perfectly.
Volume filters don’t generate entries, but they keep me out of low-probability situations.
My Combined Trading Flow
Over time, I developed a mental checklist that runs in seconds:
- Is the adaptive MA trending clearly?
- Does volume confirm direction?
- Is MACD aligned with trend?
- Is RSI near exhaustion or confirming momentum?
- Is price behavior around Bollinger Bands giving context?
If all five conditions agree, I act. If one feels weak, I pass. Across 500 live trades in 2025, this framework gives me roughly a 56–58% win rate after costs. It’s not spectacular, but it’s consistent and repeatable.
Why Most “Top 10” Lists Miss the Point
When you search online for binary options indicators, most lists recycle the same five names and call it a day. They rarely explain how to use them together, when to ignore them, or how to filter false signals. Many articles even promise win rates above 80%, which is pure fiction.
The gap I noticed and what I’m addressing here, is context. I show where these tools fail, how to tune them for short expiries, and how to measure actual expectancy. That’s what’s missing in most SEO-optimized content.
A Real Trade Example from My Journal
On July 18, 2025, I took a 5-minute binary trade on EUR/USD. The adaptive MA was rising, volume slightly above average, and MACD confirmed a bullish cross. RSI was near overbought but steady, and price had just rejected the lower Bollinger band. I took a Call. The price dipped briefly, then rallied, closing in the money.
Later, a similar setup appeared but with weak volume. I skipped it. That time, the price reversed hard, which reinforced how critical that last filter was.
Lessons Learned Along the Way
I made every mistake possible before I became consistent. I over-optimized indicators, jumped into trades without waiting for confirmations, and ignored data latency. I even traded during major news events when indicators go completely blind. Over time, I learned that patience beats prediction.
The biggest realization was that indicators don’t make money—discipline does. The tools simply guide you toward higher-quality decisions.
How to Apply These Insights
If you want to use these indicators effectively, start small. Test them in a demo account before going live. Focus on how they behave during different volatility phases. Keep a record of trades and review them weekly. Most of all, don’t overload your chart. Fewer, well-chosen indicators are more valuable than a crowded screen.
When you feel comfortable with the flow, you can open a live account here and begin applying these setups in real conditions.
If you’re looking to go deeper, you might enjoy my detailed notes on price action in binary options and binary expiry optimization, both available on my site. They build on what I’ve shared here.
Final Thoughts
The Top 5 Binary Options Indicators That Still Work in 2025 are not magic formulas. They’re filters, sharpened by trial and error. They help me trade with structure, measure risk, and stay emotionally grounded. Each trade still carries uncertainty, but these tools give me a framework to navigate it.
If you treat trading as a craft, not a gamble, these indicators can serve you well. And if you’re ready to see how they behave in live conditions, now’s the time to open your trading account and put your own observations to the test.