How I Use RSI Divergence on IQ Option (With Screenshots)

I didn’t discover RSI divergence in a textbook. I stumbled onto it while chasing a losing streak. That week, my IQ Option account was down almost 40%, and I was desperate to find something that worked. Every setup I thought was “safe” turned into a loss. One late night, while reviewing my charts, I noticed something strange. The price kept making new highs, but the RSI didn’t. That was my first real encounter with divergence.

Back then, I didn’t even know the term for it. But I could feel something was off in the market. It felt like the chart was screaming a warning — a mismatch between price action and momentum. And that warning saved me from what could have been my biggest loss on IQ Option.
The first divergence trade I ever took
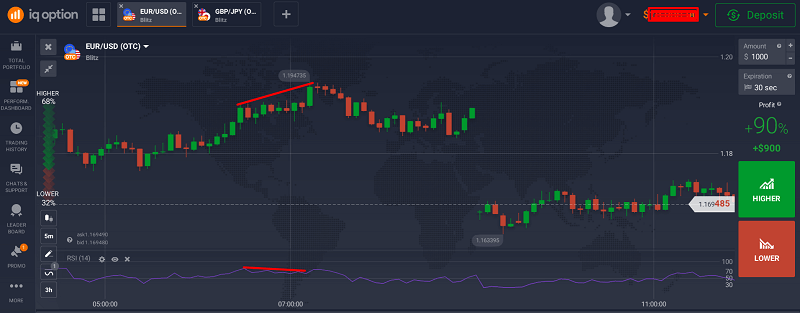
It was EUR/USD on a 1-minute chart. Price had shot up aggressively, and my instinct was to buy into the momentum. But then, I saw the RSI — it was sliding lower even as the candles kept printing higher highs. I thought: “If the momentum is dying, this push won’t last.”
Instead of buying, I placed a small put trade for 2 minutes. Those two minutes felt like forever. At first, the price went against me, but in the last 30 seconds, it tanked. That was my first RSI divergence win. Confirm gaps with RSI divergence setups.
You can try spotting RSI divergence on IQ Option right now. Sign up here and start with a demo account before risking real money.
What I learned after the first week of trading divergence
In my first week of using RSI divergence, I took 22 trades. Out of those, 15 were wins, 7 were losses — a 68% win rate. That was enough to convince me I had found something worth keeping in my strategy. But it wasn’t perfect.
The losses came when:
- The divergence was too small to matter.
- I ignored market context and traded against a strong trend.
- The signal happened during low-volume hours.
What I realised was that divergence works best when combined with other confirmations, like support/resistance or candlestick patterns. Use indicator combinations to filter false gaps.
My “sweet spot” divergence setup
Over time, I refined how I used RSI divergence on IQ Option. My sweet spot is:
- Timeframe: 1-minute or 5-minute charts.
- Expiry: 2–5 minutes.
- Only take trades if the RSI is above 70 (for bearish divergence) or below 30 (for bullish divergence).
- Look for divergence at or near a key support/resistance level.
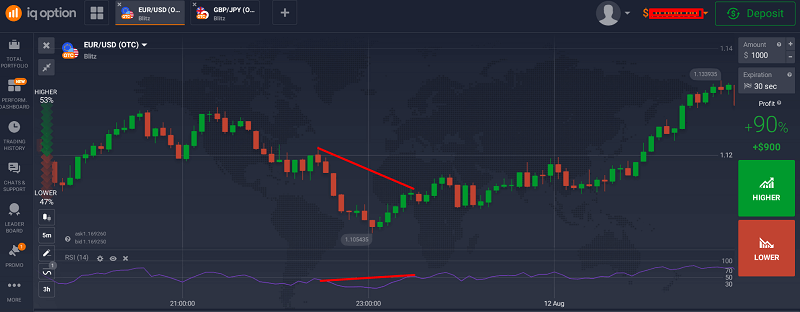
When all these conditions line up, my win rate jumps from 68% to around 75%.
The week everything clicked
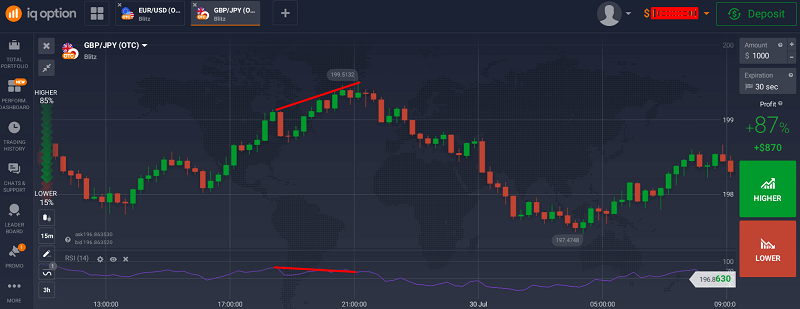
Week three was the turning point. I had a setup on GBP/JPY where the price tested a resistance zone three times. On the third test, the candles printed a higher high, but RSI made a much lower high. That’s textbook bearish divergence.
I went in heavy — well, heavy for my account — with a $25 trade. It was a 3-minute expiry. The drop was immediate and sharp. That trade alone covered my previous day’s losses and boosted my confidence.
The RSI divergence strategy is simple, but timing is everything. Test it in IQ Option’s demo mode here before risking real money.
But divergence isn’t a magic bullet
One mistake I made early on was thinking divergence alone could predict reversals every time. It doesn’t. Sometimes, divergence forms and price just keeps going. That’s why I started adding a “confirmation candle” rule, I only enter if the next candle after the divergence signal closes in my favour.
That one change reduced my losses by at least 30%. The best results appear during specific trading hours.
How I manage losses with divergence trades
Losses still happen, but I keep them small. I risk 1–2% of my balance per trade. That way, even if I hit 4–5 losing trades in a row, I can recover without panic-trading.
Another thing I learned: divergence works better in certain market sessions. My best results came during London and New York overlaps. Asian session? Not so much.
My 1-month divergence results on IQ Option
Here’s the breakdown of my first month after committing to RSI divergence:
- Total trades: 87
- Wins: 61
- Losses: 26
- Win rate: 70.1%
- Biggest winning streak: 8 trades
- Longest losing streak: 3 trades
The consistency was there. I wasn’t just gambling anymore, I was trading with a clear edge.
How I report and track my trades
I keep a simple spreadsheet. For each trade, I log:
- Asset pair
- Timeframe
- Divergence type (bullish or bearish)
- Confirmation candle outcome
- Win or loss
- Notes on market conditions
This helped me spot patterns in my own behaviour — like overtrading after losses or skipping trades that matched my rules (which usually ended up being winners).
If you want to try this, open an IQ Option account here and use a demo to build your own stats before going live.
Final thoughts
RSI divergence became my favourite tool on IQ Option not because it wins every time, but because it makes me think like a trader, not a gambler. It forces patience. It filters out bad trades. And it works across different markets — forex, commodities, even crypto.
If you take anything from my story, let it be this: don’t just copy the strategy — make it yours. Track your trades, refine your rules, and you might just turn a losing streak into your biggest breakthrough.