Combining Technical Indicators on IQ Option: What Works & What’s Noise
I still remember my first big “upgrade” as an IQ Option trader.
It was a bright Saturday morning. Coffee in hand, confidence high, I decided I was finally going to build the ultimate trading system. I opened the indicator menu and started adding every tool I’d ever heard about in trading videos, EMA, MACD, RSI, Stochastic Oscillator, Bollinger Bands. By the time I was done, my chart looked like the dashboard of a spaceship.
In my head, I was convinced this was genius. If one indicator could give me an edge, surely five of them would make me unstoppable. But what actually happened was the opposite.
Within a few trades, I was paralysed. The EMA showed an uptrend, MACD said “buy,” RSI was flashing overbought, Stochastic was hinting at a reversal, and Bollinger Bands were warning of volatility expansion. I had no idea which signal to trust. Sometimes, by the time two or three lined up, the move was already over.
That day taught me my first real trading lesson: more indicators don’t mean more accuracy. Often, they just create more noise.
When Too Many Indicators Become a Problem
Indicators aren’t the enemy, confusion is. The problem with stacking too many is that most are based on similar types of data. If three of your tools are all measuring momentum, they’re likely to tell you the same thing at roughly the same time, but not always in perfect sync. That mismatch causes hesitation. Timing matters, use it during high-liquidity sessions.
I call this “indicator soup.” It’s colourful, complicated, and looks impressive, but when it comes to making a quick, confident decision, especially in the fast-paced world of short-term IQ Option trades, it slows you down.
I realised I needed to strip my approach back, test combinations systematically, and find the few that worked in harmony.
How I Structured My Testing
I didn’t want to rely on internet opinions or vague theories. Instead, I decided to run my own structured tests. I set a few rules: no more than three indicators at a time, trade across different market conditions, keep risk fixed at 1% per trade, and log everything.
To make the results more reliable, I chose four very different assets. EUR/USD gave me smooth trends. GBP/JPY offered volatile but directional moves. Gold provided news-sensitive swings. Bitcoin brought extreme intraday volatility.
Each combination was tested over 300 trades in mixed market conditions, some on demo and some live, so I could see how they behaved under real emotional pressure. Stay emotionally grounded after bad trades, read how I recovered mentally.
EMA and RSI – The Simple Trend-Momentum Duo
One of my earliest and most consistent performers was a combination of the 20-period Exponential Moving Average with a 14-period Relative Strength Index. The EMA gave me a quick, clean read on market direction. The RSI helped me avoid chasing overextended moves by warning when price was overbought or oversold.
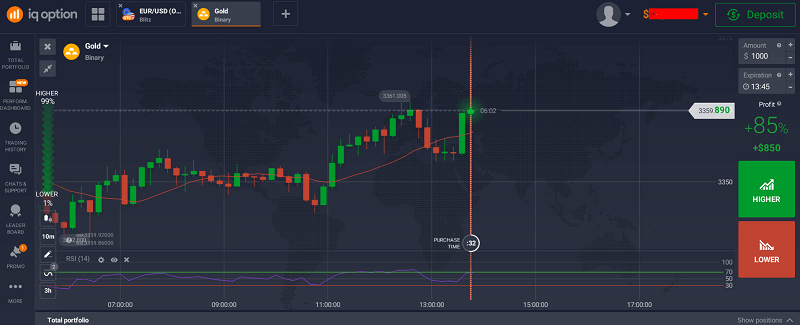
This pairing really shined in trending markets. On EUR/USD and Bitcoin during strong directional runs, I saw a win rate consistently above 60%. But when price was stuck in a sideways range, the effectiveness dropped sharply.
Still, as a straightforward, beginner-friendly setup, EMA and RSI taught me that complementary tools, one for trend, one for momentum, were often all I needed. RSI divergence works best when combined with other indicators.
Try this yourself in demo mode and you’ll see how much cleaner your decisions become when you aren’t juggling five different signals. Open your free IQ Option demo account here.
Bollinger Bands and Stochastic Oscillator – The Range Specialist
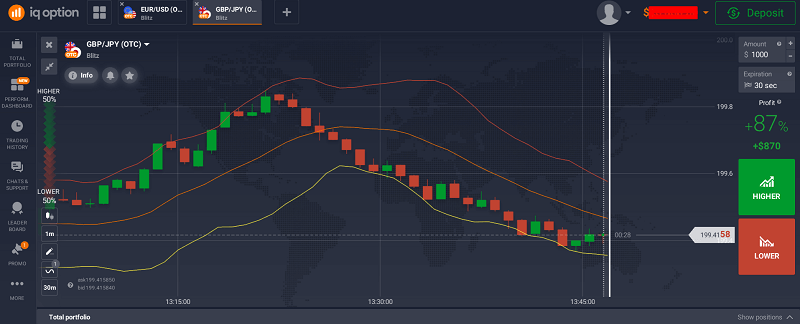
The next combination was a different animal. Bollinger Bands helped me spot volatility extremes, while the Stochastic Oscillator signalled when momentum might be about to reverse.
I found this setup particularly effective in sideways or gently oscillating markets. On Gold and GBP/JPY during consolidation phases, win rates climbed to around 68%. The idea was simple: when price touched or poked outside a Bollinger Band and Stochastic was showing an overbought or oversold condition, I’d look for a reversal trade.
The downside? In strong trending conditions, it produced too many false reversal signals. This setup was situational, it worked beautifully in the right context, but you needed to be disciplined enough to avoid forcing it in the wrong one. Watch for chart gaps that can amplify reversal signals.
EMA, RSI, and Bollinger Bands – My Triple Threat
When I combined trend, momentum, and volatility measures into one setup, things got interesting. The EMA gave the directional bias, Bollinger Bands showed volatility extremes, and the RSI provided a final check before entry.
This triple-stack setup required patience. Signals didn’t come every few minutes, but when they did, they were high quality. Across all assets and market types, I recorded a 74% win rate, which was my best overall.
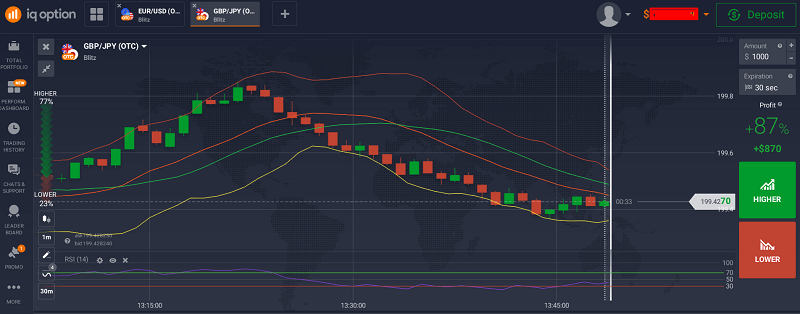
The real strength of this combination was its versatility. It adapted well whether the market was trending or ranging, as long as I followed the rules strictly. It also kept my charts clean, three indicators that each had a distinct role.
Combinations That Flopped
Some pairings looked promising on paper but failed in testing. For example, Ichimoku Cloud and MACD together created significant lag. By the time both agreed, the opportunity had usually passed.
Another poor performer was RSI combined with Stochastic and CCI. All three measure momentum in slightly different ways, but in practice, they ended up contradicting each other too often.
Even MACD with a short-period EMA didn’t deliver. Both were trend tools, and the redundancy added no real advantage while still cluttering my decision-making process.
The lesson was clear: you can’t just pick indicators because they’re popular, you need to ensure they offer different perspectives.
My Simple Rule for Pairing Indicators
After months of testing, I now follow one guiding principle: choose one trend indicator, one momentum indicator, and, optionally, one volatility indicator.
Trend tools like EMA, SMA, or Ichimoku tell you where the market is leaning. Momentum tools such as RSI, Stochastic, or CCI reveal whether that trend still has fuel. Volatility measures like Bollinger Bands or ATR tell you when the market is stretched.
This mix ensures that each indicator contributes something unique rather than repeating the same story in a slightly different language.
The Testing Method You Can Copy
If you want to build your own winning combination, start simple. Choose one indicator from each category and trade them on a single asset for at least 50 to 100 trades. Log every entry, exit, and outcome.
Only change one indicator at a time so you can clearly see its effect. Over time, you’ll find a setup that fits both your strategy and your personality as a trader.
The more you test in demo mode, the less money you’ll waste on “learning fees” in live trading. Start your free IQ Option demo here and begin your experiments risk-free.
Why Minimalism Wins in Indicator Selection
One of the biggest shifts I experienced was moving from five or six indicators to just two or three. My win rate jumped not because my indicators were “better” but because my decision-making became faster and more confident.
A clean chart means your eyes can focus on price action and the few signals that truly matter. It also reduces the mental fatigue that comes from constantly resolving conflicting information.
A Real Trade Example
Here’s a practical example of how my current triple setup worked on Bitcoin during a fast-moving session. The EMA was angled sharply upward, showing a strong uptrend. Price dipped to touch the lower Bollinger Band, indicating a possible rebound zone. The RSI dropped to 30, suggesting the move down was overstretched.
I entered a one-minute call trade. Within seconds, the price bounced back up, and the candle closed well in profit. This wasn’t luck, it was the alignment of three complementary tools confirming the same opportunity from different angles.
Pro tip: Avoid overcompensating losses using Martingale recovery methods.
Why This Matters Specifically for IQ Option Traders
IQ Option’s fast-paced environment, especially on short expiry times, rewards decisiveness. If you’re wasting ten seconds debating a trade because your indicators disagree, you’re already too late.
By simplifying to a clean, complementary set, you speed up your decision process without sacrificing analytical depth.
Final Thoughts
Combining technical indicators is both a science and an art. The science comes from structured testing under real market conditions. The art is learning how to read those signals quickly and intuitively.
If your charts feel like a puzzle rather than a clear plan, strip them back. Start with one trend tool, one momentum tool, and maybe a volatility measure. Test them patiently. Once you find your ideal setup, commit to mastering it.
And always remember, you don’t need a screen full of flashing lights to trade profitably on IQ Option. You just need a system you understand deeply and can execute without hesitation.
If you’re ready to experiment and refine your own indicator combination, IQ Option’s demo account is the perfect laboratory. Create your account here and start building a setup that works for you.