ExpertOption Candlestick Patterns Every Trader Should Know

When I first opened my ExpertOption account, I didn’t know how much the little “candles” on a chart could reveal. I thought they were just fancy visuals for price movements. But over time, I realized those candlesticks carried stories about the market’s psychology—stories I could learn to read. Understanding candlestick patterns changed how I placed trades and how I saw risk. Today, I want to share my journey with you—what I learned, how I applied it, and the lessons that made me a better trader.

👉 Start your own journey on ExpertOption today and experience these strategies firsthand, Sign up here.
My First Encounter with Candlestick Patterns
Like many beginners, I started with line charts because they felt simpler. But the problem was, line charts only told me where the price closed. I couldn’t see what happened in between. On a losing streak, I switched to candlesticks almost by accident, and suddenly the charts looked alive. I could see battles between buyers and sellers play out within each candle.
At first, I felt overwhelmed. But I quickly noticed that certain shapes kept repeating themselves before big moves. That curiosity pulled me deeper into the world of candlestick patterns.
Why Candlesticks Matter on ExpertOption
Trading on ExpertOption often involves quick decisions, especially with short-term expiry options. Candlestick patterns are perfect for this style because they compress hours of psychology into a single signal. They don’t guarantee wins (nothing does), but they increase my confidence when timing entries.
Here’s what candlesticks showed me:
- Where buyers and sellers were strongest.
- Whether momentum was fading or building.
- If a reversal might be coming.
- Whether I should wait, enter, or walk away.
That last point—knowing when not to trade—probably saved me the most money.
The Core Candlestick Patterns I Use
Let me walk you through the patterns that shaped my trading. I’ll explain them the way I discovered and tested them in real trades.
1. The Doji: My Wake-Up Call
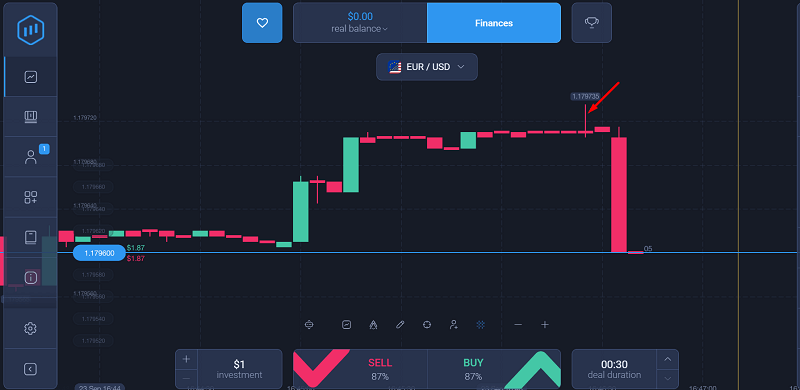
The first pattern I recognized was the Doji, a candle where the open and close are nearly the same. The first time I noticed it was on EUR/USD during a volatile afternoon. I had just lost two trades trying to chase the market. Then, a Doji appeared at the top of a rally. Out of frustration, I didn’t trade. Minutes later, the price reversed. That Doji was a warning I ignored—until I saw it repeat again and again.
Lesson learned: Dojis don’t predict direction, but they scream indecision. When I see them, I pause.
2. Hammer and Inverted Hammer: My Lifesavers
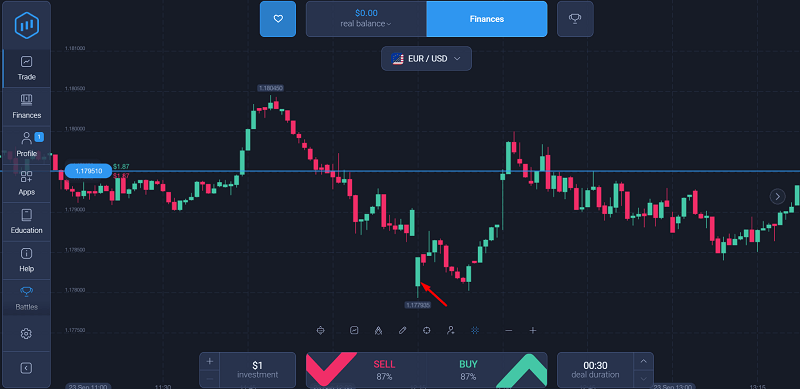
I remember the first time I spotted a Hammer on the EUR/USD chart. The market had been dropping, and I was about to go short again. But that Hammer—tiny body, long lower wick—made me hesitate. I opened a small call option instead. That trade won, and I slowly realized Hammers often mark the end of selling pressure.
Here’s how I break it down:
| Pattern | Where It Appears | What It Means | My Action |
| Hammer | After a downtrend | Buyers fought back | Look for call (up) |
| Inverted Hammer | After a downtrend | Reversal possible but weaker | Small test trades |
3. Engulfing Patterns: My Confidence Builders
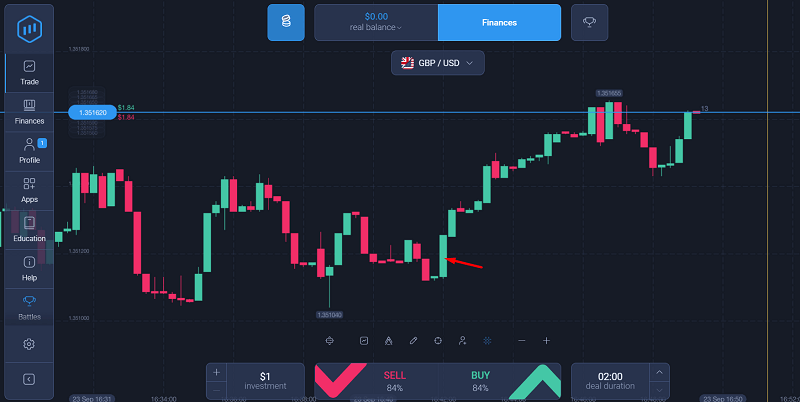
The Bullish Engulfing pattern became one of my favorites. I first spotted it on GBP/USD, where a big green candle completely swallowed the previous red one. That was the moment I stopped doubting candlesticks. I placed a call option, and the trade closed in profit.
The opposite, Bearish Engulfing, taught me to respect downward pressure. Once, I ignored it on Apple stock and ended up with a string of losing puts.
Rule of thumb I follow: Engulfing patterns are stronger when they happen at clear support or resistance zones.
4. Morning Star and Evening Star: My Game Changers
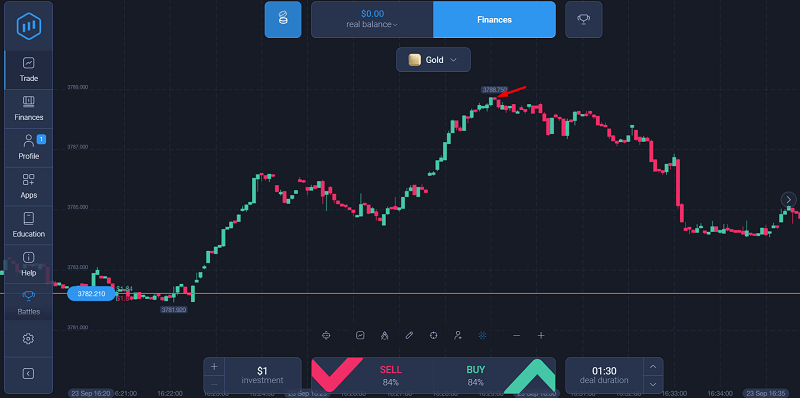
These three-candle patterns took longer for me to spot, but they’re worth it. One night, I noticed a EveningStar on gold. A red candle, then a small indecisive one, followed by a strong red candle. It was like watching buyers exhaust themselves before buyers stepped in. That trade gave me one of my biggest daily gains.
The Morning Star taught me humility. I ignored it during a bearish run on oil, thinking the trend was unstoppable. That mistake cost me five losing trades in a row.
5. Shooting Star: My Hard Lesson
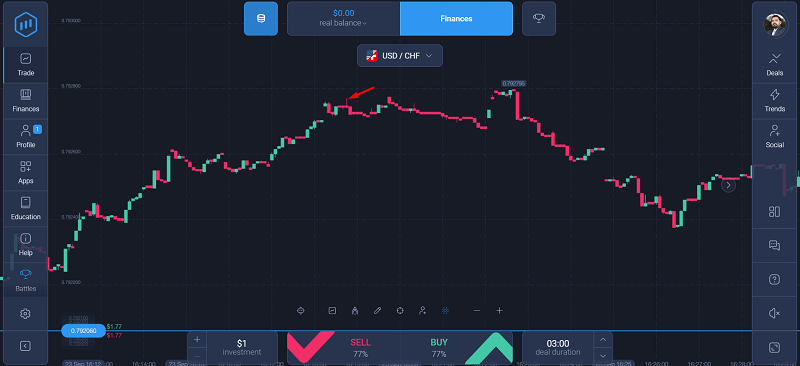
The Shooting Star has a long upper wick with a small body near the bottom. The first time I saw it, I didn’t believe it. I was bullish on USD/CHF, but the Shooting Star appeared after a rally. I still placed a call option, and it lost badly. Since then, Shooting Stars became my personal red light.
How I Practiced Reading Patterns
I didn’t master these overnight. Here’s what I did:
- Demo trading first: I practiced on ExpertOption’s demo until I could spot patterns in real time.
- Screenshots: I took screenshots of every pattern I saw and labeled them with outcomes.
- Small stakes: When I moved to live trading, I used the minimum trade size until I felt consistent.
👉 Ready to test these patterns yourself? Open a free demo or live account on ExpertOption Click here to start.
The Mistakes I Made Along the Way
Candlestick patterns are powerful, but they’re not magic. My biggest mistakes were:
- Trading patterns without context (ignoring trend or support/resistance).
- Overtrading after one successful pattern.
- Assuming every Doji or Hammer would work.
Once I added context—looking at trends, news, and volume—my accuracy improved.
How Candlestick Patterns Fit into My Strategy
These days, I don’t use candlesticks in isolation. I combine them with:
- Support and resistance levels (see my guide on drawing support and resistance).
- Indicators like RSI and Moving Averages for confirmation (read: ExpertOption indicators that work).
- Risk management rules to protect my account.
This balanced approach turned candlestick reading from a hobby into a core skill.
Quick Reference: Patterns I Watch the Most
Here’s a table I still keep pinned to my desk:
| Pattern | Signal | Strength |
| Doji | Indecision | Neutral |
| Hammer | Bullish reversal | Strong |
| Inverted Hammer | Possible reversal | Moderate |
| Bullish Engulfing | Strong up move | Strong |
| Bearish Engulfing | Strong down move | Strong |
| Morning Star | Bullish reversal | Very strong |
| Evening Star | Bearish reversal | Very strong |
| Shooting Star | Bearish reversal | Strong |
My Takeaway After Months of Practice
Looking back, candlestick patterns were my doorway into understanding price action. They made me stop relying solely on indicators and start reading the raw market story. Were there losses? Plenty. But each loss carried a lesson.
Now, when I open my ExpertOption charts, I don’t just see candles—I see signals, warnings, and opportunities. And I trade with more patience than I ever had as a beginner.
👉 If you’re ready to explore candlesticks on your own, start practicing on ExpertOption today Join now.
Final Thoughts
If you’re just starting out, candlestick patterns might look intimidating, but they’re easier to learn than they appear. Think of them as the alphabet of trading—once you recognize the letters, you can start forming words, then sentences, and eventually your own trading language.
Take your time, practice relentlessly, and never risk more than you can afford. My journey with candlesticks wasn’t about finding a shortcut—it was about learning to listen to the market.
And trust me, once you start hearing that language, your trades on ExpertOption will never feel the same.