Combining Multi-Chart Layouts With Indicators on IQ Option

I remember the first time I stumbled across the multi-chart layout feature on IQ Option. It wasn’t planned. I had just finished a string of trades using the IQ Option chart gaps I wrote about before, and I felt like I was missing something. My entries looked fine on one chart, but when I reviewed them later, I realised my timing could have been sharper if I had checked another timeframe or compared another asset side by side. That thought was enough to spark curiosity.
At first, the idea of handling multiple charts on a single screen felt overwhelming. But I couldn’t shake the question: could combining multi-chart layouts with indicators actually help me find cleaner entries? That’s when I decided to test it.

If you’re new to IQ Option, this is the perfect feature to explore once you sign up. The platform makes it simple to open a free account and test strategies without pressure. Start here with IQ Option and see how multi-chart layouts can sharpen your setups.
How I Set Up My First Multi-Chart Strategy on IQ Option
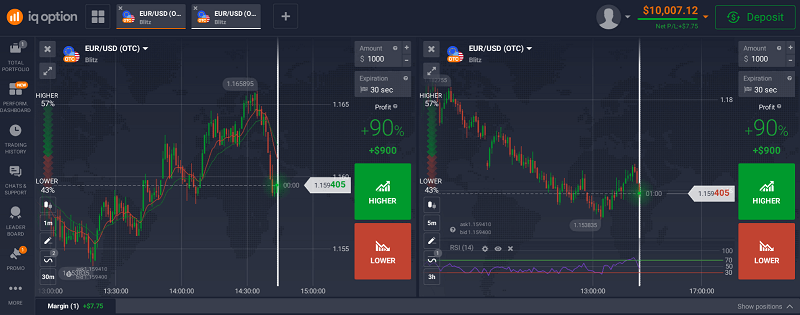
I began with two charts open side by side. Both showed EURUSD. One was set to the 1-minute timeframe, the other to the 5-minute.
- On the 1-minute chart, I used a 10 EMA and 20 EMA crossover for entry signals.
- On the 5-minute chart, I used RSI (14) with standard levels of 30 and 70.

My rule was simple: take a trade only when the crossover on the fast chart matched RSI direction on the slower one.
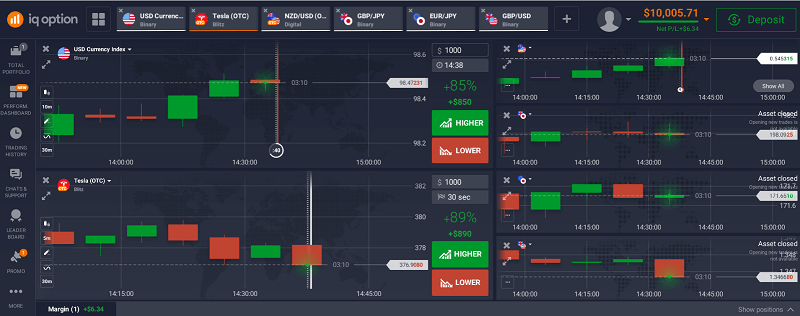
Later, I moved to a 4-chart layout. This setup included EURUSD, GBPUSD, EURJPY, and BTCUSD. I was curious whether spotting similar signals across correlated pairs could strengthen my conviction.
Real Trade Examples With IQ Option Multi-Chart Layouts
To show you how this worked in practice, here are a few trades I logged:
| Asset | Setup Type | Position | Result | Notes |
| EURUSD | EMA crossover + RSI rising | Call 3m | Win | RSI climbing from 40, price closed +2.5 pips |
| EURUSD | EMA crossover + RSI near 70 | Call 3m | Loss | Entered late, reversal within 1 minute |
| GBPUSD | EMA + RSI, correlated w/ EURUSD | Call 5m | Win | Both pairs aligned and moved together |
| BTCUSD | Same EMA/RSI combo | Put 3m | Loss | High volatility, signal not reliable |
After 12 trades, I was 7–5 in wins and losses. That gave me a 58% win rate. After 50 trades, I finished with 29 wins, 21 losses, and a small net profit of $72.
Not spectacular, but consistent enough to convince me that the structure worked.
When I first opened the multi-chart layout, I realised how much more depth IQ Option offers compared to single-chart trading. If you haven’t tried it yet, you can create your account on IQ Option and follow the same setup I used. It takes minutes, and you can start testing different indicator combinations right away.
What I Learned From This IQ Option Strategy
What Worked Well
- Waiting for both charts to align kept me patient.
- Correlated pairs like EURUSD and GBPUSD gave stronger signals.
- EMAs on fast charts paired with RSI on slower charts provided clarity.
What Didn’t Work
- Copying the same rules to BTCUSD was a mistake. Crypto’s volatility required a different approach.
- Increasing size too quickly after early wins hurt overall consistency.
- Ignoring divergence between assets led to weaker entries.
Some of these lessons echoed what I experienced while testing the IQ Option 1-minute strategy. The framework worked, but execution and discipline mattered more.
Takeaways for Traders Using Multi-Chart Layouts on IQ Option
Start Small
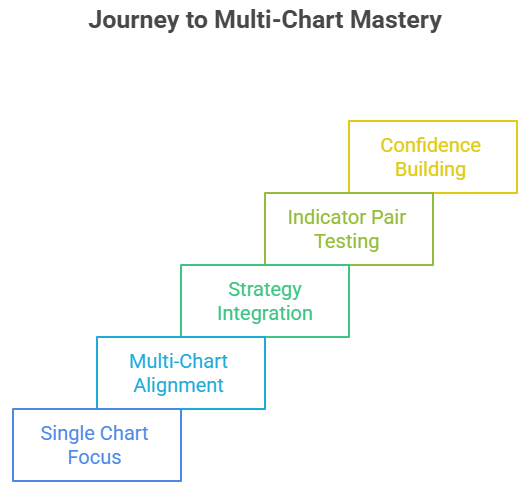
Use two charts before jumping into four. One short timeframe and one long timeframe is enough at first.
Limit Your Indicators
More indicators don’t mean better trades. EMA and RSI gave me the clearest setups.
Track by Asset Type
Forex pairs responded well. BTC didn’t. Write this down in your journal.
Stay Disciplined With Size
One of my biggest mistakes was overconfidence. Equal position sizing kept my later results steadier.
Use the Platform Features Fully
IQ Option’s multi-chart view isn’t just a gimmick. It can add structure to your analysis and prevent impulsive trades. For a deeper dive, check out my guide on best time to trade in IQ Option.
How Multi-Chart Layouts Changed My IQ Option Journey
This experiment reshaped how I look at trades. Instead of focusing on a single candle or indicator, I now look for alignment across different charts. That shift alone made me more selective.

Some setups reminded me of the candlestick trades I covered in my IQ Option RSI divergence, while others connected more with the short-term tactics I tested in the 1-minute strategy. By combining these lessons, I started building a toolkit rather than chasing one-off signals.
My next step is to test new indicator pairings within the multi-chart setup. I want to see how stochastic and MACD work together in forex, compared with EMA and RSI in equities. This setup relies on multi-indicator combinations.
Trading will always be about experimenting and improving. If you’re still trading on one chart, you’re limiting yourself. Open an IQ Option account, set up a multi-chart layout, and start testing strategies with your own eyes. It’s the fastest way to build confidence in your setups.
Closing Reflection
Combining multi-chart layouts with indicators didn’t change my win rate overnight. What it did was force me to slow down, confirm trades across perspectives, and avoid unnecessary entries. That discipline is now part of my process.
If you’ve been trading on a single chart, try expanding to a two-chart setup on IQ Option. It might feel like a small step, but the insights you gain could reshape how you see setups altogether.
Trading is a long journey. Every experiment adds a new piece to the puzzle. This was mine, and it’s already shaping the way I approach my next strategies on IQ Option.