XRP Is Retesting Broken Support From Below — The Cleanest Tell on the Chart
The most underrated signal in technical analysis
There is a moment in every downtrend that separates a pause from a reversal, and it is not the low. It is the first serious rally back into the level that broke. Old support becomes resistance, and how price behaves the first time it returns there tells you whether sellers are still organised or whether they have run out.
XRP is at exactly that moment.
Where the XRP chart stands
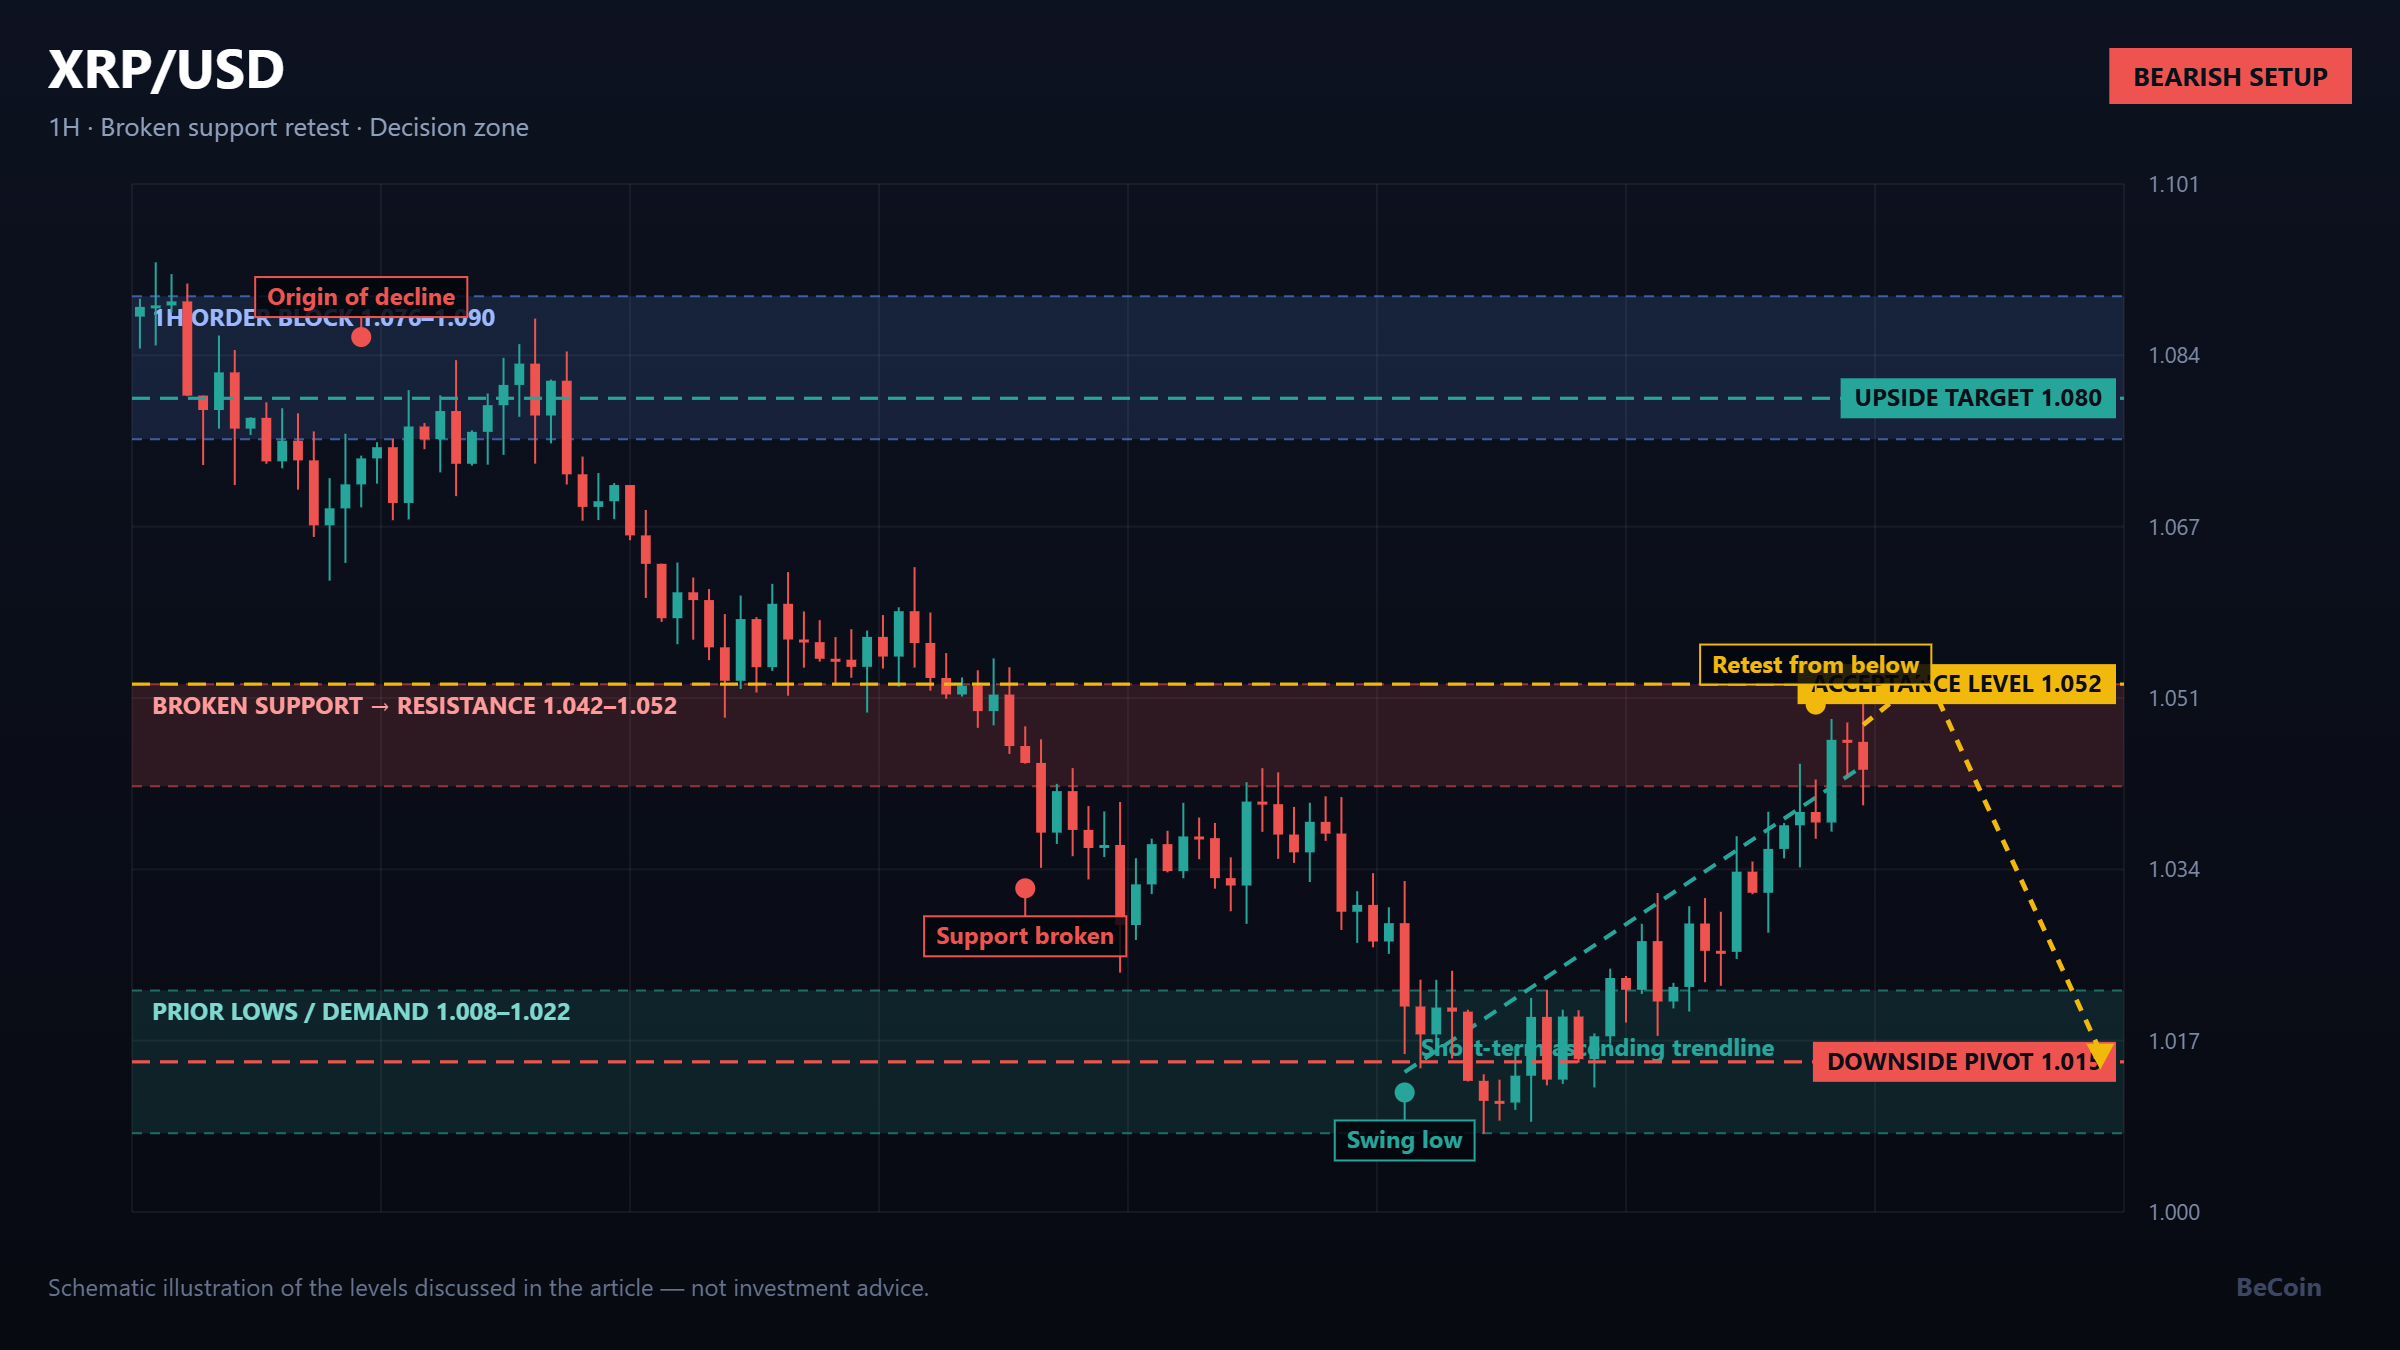
The hourly structure has been bearish, with price sliding from the 1.08 to 1.09 region down toward 1.01 to 1.02. That decline broke a shelf of support around 1.042 to 1.052 that had held multiple times on the way up. The subsequent recovery has now carried price back into that same band, approaching it from underneath along a short-term ascending trendline.
This is a decision zone, not a reversal signal. The distinction matters. Plenty of traders treat a return to broken support as an automatic short, and plenty of others treat the ascending trendline as an automatic long. The chart has not told either group they are right yet.
The bullish path
If XRP produces clear acceptance above 1.052 rather than a single wick through it, the character of the move changes. Acceptance means hourly closes above the level and, ideally, a pullback that holds it as support. At that point the reclaimed structure becomes the new floor and the higher-timeframe order block in the 1.08 region becomes a realistic objective.
The distance from 1.052 to 1.08 is not enormous, but it is a clean move with a definable invalidation, which is more than most crypto setups offer.
The bearish path
The alternative is the more common outcome. Price taps the band, wicks into 1.05, and rolls over. In that scenario the ascending trendline breaks, the recovery is confirmed as a corrective bounce, and the prior lows around 1.01 to 1.02 come straight back into play. Below that, there is not much structure until noticeably lower levels.
The tell here is volume and candle character. A rejection with a long upper wick and expanding volume is a very different message from a slow sideways drift that grinds through the level.
The trendline nobody should over-trust
Short-term ascending trendlines in a broader downtrend are fragile. They work until they do not, and they usually break at the worst possible moment for whoever is leaning on them. Using the trendline as a trigger is reasonable. Using it as a thesis is not.
What to actually watch
Three things, in order. First, whether hourly closes appear above 1.052 or only wicks. Second, whether the first pullback after any break holds the level. Third, whether the ascending trendline survives the retest. If all three line up bullish, the 1.08 area is the target. If the trendline breaks while price is still under 1.052, the path of least resistance points back to 1.01.
Bottom line
XRP is retesting broken support from below, which is the single cleanest tell available on this chart right now. Acceptance above 1.052 opens 1.08. Rejection there, combined with a trendline break, sends price back toward 1.01 to 1.02. Waiting for the reaction beats predicting it.
Becoin.net Premium Forecast - Becoin.net Tariff Plans
This article is educational market commentary and is not investment advice. Cryptocurrency markets are volatile; trade your own plan and manage risk accordingly.

Chasing Safety in a High-Stakes World: My Quest for the Best Low-Risk Trading Platforms
I still remember the sinking feeling in my stomach when I lost my first tiny trading account. It wasn’t a massive fortune, but it was mine. That night, I realized a brutal truth about this industry: most beginners fail not because they lack passion, but because they dive into high-risk environments without a life jacket. […]

Which Broker Has Faster Withdrawals? Real 2026 Comparison for Traders
When most beginners choose a broker, they focus on bonuses, signals, or flashy interfaces. But after trading for a while, you realize one thing matters more than almost anything else: How fast can you actually withdraw your money? A broker can look perfect until your first withdrawal request gets stuck in “processing” for three days. […]

Binomo vs IQ Option for Small Accounts: Which Platform Is Better for Beginners in 2026?
Most people entering online trading do not start with thousands of dollars. They start small. Usually with $10, $20, or maybe $50. That small balance changes everything about how a trader behaves. Every loss feels bigger, every win feels emotional, and every mistake has a stronger impact on the account. This is exactly why beginner […]

Binomo First $10–$50 Test Deposit Plan: The Safest Way to Validate the Platform Before Scaling
I didn’t start with confidence. I started with doubt. Every time I searched for answers about Binomo, I found opinions, not proof. Some people claimed fast withdrawals. Others complained about delays. But almost nobody showed a complete journey from deposit to withdrawal using real money. So I stopped reading and started testing. Instead of risking […]

How Liquidity Affects Day Trading Results
When I first started trading day trading, I believed success was all about finding the perfect indicator. I spent weeks testing moving averages, RSI settings, support and resistance levels, and dozens of YouTube strategies that promised easy wins. Some worked for a few trades, but most failed. What confused me was that the same setup […]

The Day I Stopped Trading and Finally Started Making Money
It was a rainy Tuesday morning, and I was staring at my screen with a familiar knot in my stomach. The previous three days had been a slow, agonizing slide into the red. I had given back two weeks of hard-earned profits in less than seventy-two hours. Every asset I clicked on looked like a […]