USD/CNH Forecast: Coiling Above 6.7150 as the Yuan Bids
The move that has already happened
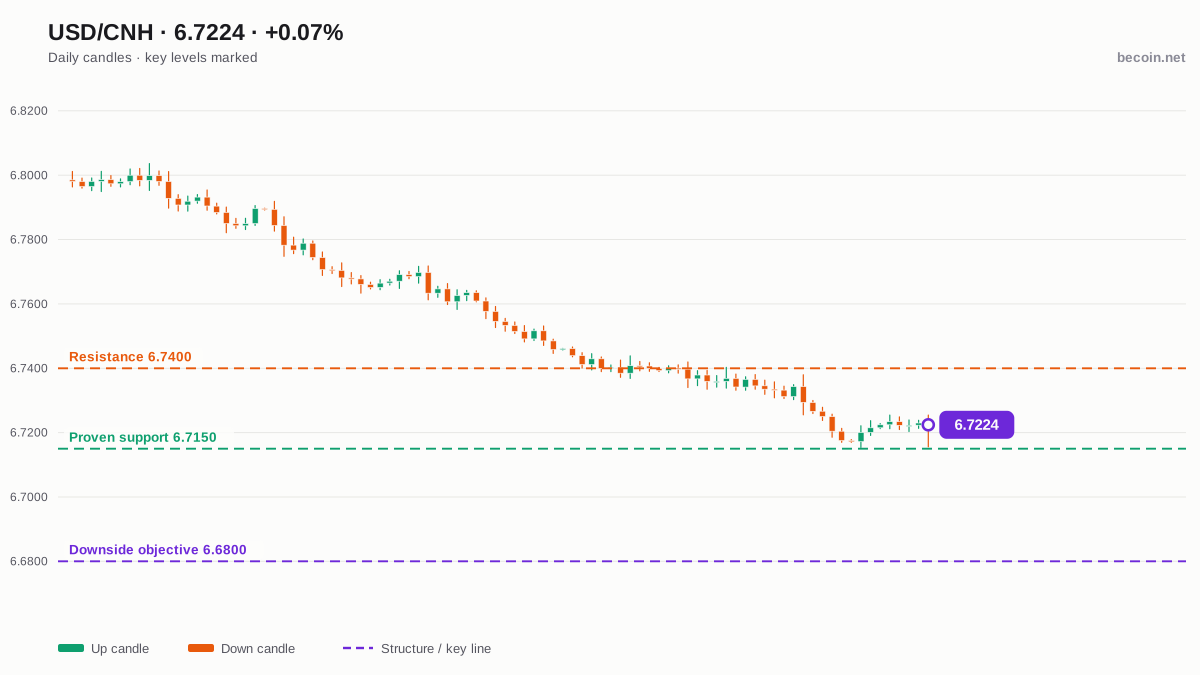
USD/CNH sat at 6.72242 on Monday, 0.07% above the prior close of 6.71742 and inside a tight 6.71558 to 6.72544 band. Look past the day and the trend is unambiguous: down 0.36% on the week, 0.82% on the month, 2.27% over six months and 3.65% year to date. Over twelve months the pair has surrendered 6.40%. The offshore yuan has been steadily appreciating, and the market has stopped treating that as a surprise.
What makes the current setup interesting is not the direction of the trend. It is that price has stopped falling in a specific place and started compressing there.
Support that has already been proven
The 6.7150 to 6.7180 area has been tested repeatedly over the past several sessions and has not broken. Monday’s low of 6.71558 was another test that held. When a level absorbs that many attempts without giving way, it stops being a guess and becomes a reference point that both sides trade against.
Several community reads are leaning long from precisely this shelf, describing bulls coiled at proven support with momentum divergence building underneath. One of the more specific counts frames the recent decline as an ending diagonal, which would make the current compression the base for a reversal rather than a pause in the downtrend. The common thread across those setups is patience: most are waiting for a pullback into support rather than chasing, which is a reasonable instinct in a pair whose daily ranges rarely exceed a hundred pips.
Two levels, two outcomes
On the upside, 6.7400 is the first real barrier. It caps the current compression and coincides with the highs of the last fortnight. A daily close above it turns the coiling into a breakout and makes 6.7850 the logical next objective, which is where the August decline began.
On the downside, a daily close under 6.7150 removes the entire bullish premise in one candle. The next area with any history behind it sits near 6.6800, and given how orderly this downtrend has been, there is little reason to expect a violent stop on the way there. Traders working the long side of this shelf need that level as a hard invalidation, not a mental one.
What is actually driving it
The offshore yuan does not float freely in the way the krone or the Singapore dollar do. The daily reference rate anchors expectations and the authorities have shown a clear preference for orderly, gradual appreciation rather than sharp moves in either direction. That policy preference is why this chart looks so mechanical: long shallow slides punctuated by tight consolidations, with very few gaps and almost no panic candles.
It also explains why the compression matters more here than it would elsewhere. In a managed float, a range that holds for a week or more usually reflects a stable reference rate. When the range breaks, it often breaks because the anchor moved, and those moves tend to run further than the technical picture alone would imply. Level maps and scenario weightings for the pair are published in the Becoin.net Premium Forecast, and the access tiers are set out in the Becoin.net Tariff Plans.
Bottom line for the USD/CNH forecast
A confirmed downtrend that has paused on proven support, with a divergence-backed long case that has a clean and nearby invalidation. The trade is not the direction, it is the level. Wait for 6.7150 or 6.7400 to resolve on a daily close and take the side the market hands you.

Trading Currency Strength Instead of Single Pairs
It was a Tuesday afternoon when I realized I was fighting a losing battle against a ghost. My screen was a chaotic web of indicators. I had the EUR/USD chart open, a moving average crossing over here, a relative strength index flashing oversold there, and a price action setup that looked textbook perfect. I clicked […]

Finding the Best Trading Broker for Side Income: My Raw, First-Hand Journey to Consistent Daily Wins
Six months ago, I sat at my kitchen table staring at an accumulation of household bills, realizing my primary salary was no longer cutting it. I didn’t want a second job that required clocking into a physical location or taking endless boss mandates after hours. I needed a flexible, scalable side income. That night, I […]

Which Broker Is Better for Weekend Trading?
It was a chilly Saturday morning, and while the rest of the world was sleeping in or catching up on shows, I was staring at a completely frozen screen. My usual EUR/USD chart looked like a heart monitor flatlining. The traditional markets were closed. The banks were shut down. For a long time, that was […]

Deriv vs IQ Option for Synthetic Indices: Which Platform Is Better in 2026?
Synthetic indices have become one of the most talked about trading categories among beginners and experienced traders alike. Unlike forex or crypto markets that depend on real world events, synthetic indices operate 24/7 using algorithm driven price movements. That means traders can access opportunities at any time without waiting for market openings or major news […]

Deriv Volatility 75 Strategy Backtest: What Actually Works After 1,000 Trades?
The first time I tried trading Volatility 75, I thought I had found the perfect market. No news shocks. No central banks. Just clean, continuous price movement. Within two weeks, I blew my first account. That experience forced me to stop guessing and start testing. Instead of chasing indicators or copying strategies from forums, I […]

EUR/USD holds 1.1414 before the ECB decision: three scenarios
EUR/USD traded near 1.1414 before the ECB’s July decision. Here is what a hold, hawkish hold or surprise hike could mean for 1.1350 and 1.1480.