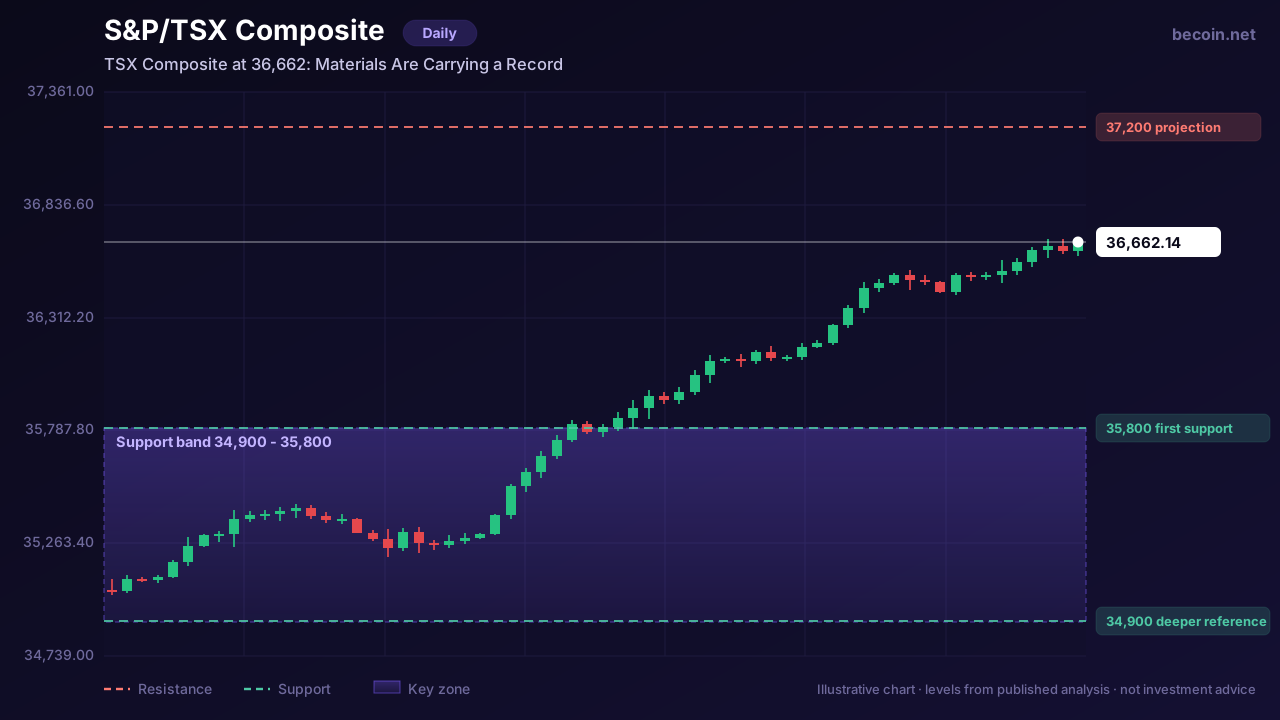
TSX Composite at 36,662: Materials Are Carrying a Record That Gold Could Break
The S&P/TSX Composite closed at 36,662.14, adding 186.22 points in a session led by basic materials and financials. The index is up about 1% on the week, 3.5% on the month, roughly 15% year to date and more than 31% over twelve months. Those are extraordinary numbers for a benchmark that spent much of the last decade being described as structurally sluggish.
Who is actually doing the lifting
The composition of the gain matters more than the gain itself. Canada's index is dominated by three blocks — financials, energy and materials — and the materials weighting is the one that has changed the character of the market. With gold trading at levels that would have seemed implausible two years ago, Canadian miners have re-rated hard, and that re-rating has flowed directly into the index.
Financials have contributed too, helped by a rate backdrop that has been kinder to bank margins than expected. But the marginal driver, the thing that has turned a decent year into a spectacular one, is the metals complex.
The concentration risk nobody prices
This is where the record deserves scrutiny. An index that reaches all-time highs on the back of one sector is more fragile than its chart implies, because the diversification that investors assume they own is not actually there. Several analysts have flagged precisely this — pointing at topping formations in gold miners and arguing that a roughly 5% index pullback would follow if that leadership rolls over. Our Becoin.net Premium Forecast follows this index through each of those levels session by session.
That is not a bearish call on Canada. It is an observation about correlation. If gold corrects meaningfully, there is no obvious second engine to take over. Energy has been stable rather than strong, and the financials are performing well but not in a way that could offset a materials unwind on its own.
TSX Composite levels that matter on a pullback
The first reference below the record is around 35,800, which is where the index consolidated before the most recent leg. That is the level that separates a routine pause from something more meaningful. Below it, 34,900 is the more substantial shelf and roughly corresponds to the 5% correction some analysts have been modelling.
On the upside, an index in record territory has no overhead supply by definition, so the projections traders are working with — the 37,200 area is the most commonly cited — come from channel extensions rather than prior price memory. Treat them as loose guides rather than magnets.
What would confirm the trend
The healthiest thing that could happen from here is a broadening of leadership. If the index continues higher with financials and energy carrying more of the load and materials merely participating, the advance becomes considerably more durable. If it continues higher on materials alone while the rest of the market flattens, the record is being built on a single position.
There is also a calendar consideration. Canadian bank earnings have historically been a volatility event for this index, and with financials as the second pillar of the current advance, that reporting window is where the broadening thesis gets tested directly.
For now, the trend is up, the structure is clean and the record is real. The caveat is simply that "the TSX is at an all-time high" and "Canadian equities are broadly strong" are not quite the same statement, and the gap between them is where the risk sits.
Access levels for the daily level maps, scenario updates and alerts are set out on Becoin.net Tariff Plans.
This is market analysis for educational purposes and is not investment advice. Trading carries risk of loss.

Why Traders Move from Binomo to Deriv in 2026: The Real Reasons Behind the Switch
If you spend enough time around trading communities, you’ll notice a pattern. Many traders start with Binomo. Then, after a few months, a surprising number begin looking at Deriv. Some switch completely. Others keep both accounts but gradually move most of their trading activity to Deriv. I noticed this trend while talking to beginner traders […]

Binomo Demo vs Real Account: What Changes After You Deposit (KYC, Payout, Support, Limits)
I spent far too long thinking my Binomo demo results meant I was “ready.” On demo, everything felt clean. My entries looked sharp. My timing looked better than it probably was. I could reset virtual balance, test ideas, and convince myself I had control. Then I made my first real deposit, and that’s when I […]

EUR/USD holds 1.1414 before the ECB decision: three scenarios
EUR/USD traded near 1.1414 before the ECB’s July decision. Here is what a hold, hawkish hold or surprise hike could mean for 1.1350 and 1.1480.

Trading Currency Strength Instead of Single Pairs
It was a Tuesday afternoon when I realized I was fighting a losing battle against a ghost. My screen was a chaotic web of indicators. I had the EUR/USD chart open, a moving average crossing over here, a relative strength index flashing oversold there, and a price action setup that looked textbook perfect. I clicked […]

The Day I Stopped Trading and Finally Started Making Money
It was a rainy Tuesday morning, and I was staring at my screen with a familiar knot in my stomach. The previous three days had been a slow, agonizing slide into the red. I had given back two weeks of hard-earned profits in less than seventy-two hours. Every asset I clicked on looked like a […]

Which Broker Is Better for Weekend Trading?
It was a chilly Saturday morning, and while the rest of the world was sleeping in or catching up on shows, I was staring at a completely frozen screen. My usual EUR/USD chart looked like a heart monitor flatlining. The traditional markets were closed. The banks were shut down. For a long time, that was […]