Toncoin Rebuilds From $1.65 Support With $1.90 as the Gate
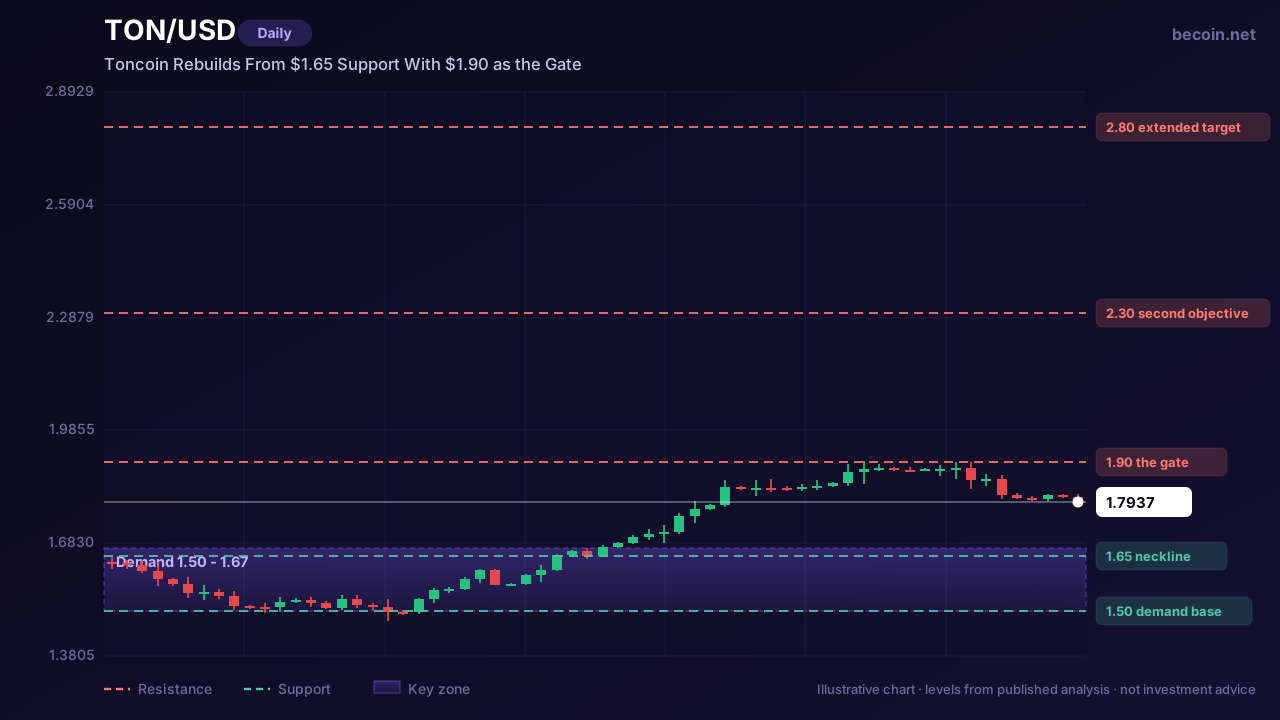
Toncoin is trading around $1.79, up more than 3% on the day and about 36% over the past month, yet still down roughly 5% on the week. Those figures look contradictory until you look at the chart, where they describe something fairly ordinary: a sharp recovery off a base, followed by the first real test of whether that recovery holds.
The demand zone that started this
The $1.50 to $1.65 area is where this move began. It is the region where TON stopped making lower lows, where buyers showed up repeatedly rather than once, and where the structure that most traders are working from was formed. Several analysts have described it as a double-bottom base with a neckline around $1.65 to $1.67, and while pattern labels are always somewhat arbitrary, the practical point stands — that zone produced a durable turn.
What matters now is that price is well above it. The base has done its job. The question has shifted from whether TON can stop falling to whether it can do anything more than retrace.
The Toncoin gate at $1.90
Around $1.90 is the level that decides that question. It is the top of the recovery so far, it aligns with where the previous breakdown accelerated, and it is the last piece of overhead supply before the chart opens up. Everything below it is a bounce inside a larger downtrend. Above it, the structure changes. Our Becoin.net Premium Forecast follows this token through each of those levels as the range resolves.
The distinction is not academic. A 36% monthly gain sounds like a trend until you notice it started from a deeply oversold base and has not yet cleared the level where the decline began. Recoveries of that shape stall at exactly this kind of resistance more often than they break through it — which is why the reaction at $1.90 is worth more attention than the move that got price there.
Targets that only exist above the gate
If $1.90 is taken on a daily closing basis, the references most traders are using are $2.30 and then the $2.80 area. Both correspond to prior consolidation shelves rather than arbitrary projections, which makes them reasonable places to expect friction. The longer-horizon Elliott Wave crowd points considerably higher, toward $5 and beyond, but those counts depend on a structure that has not yet been confirmed and should be treated as scenario rather than forecast.
The practical sequence is simple: clear $1.90, retest it successfully, then treat $2.30 as the working objective. Skipping the first two steps is how traders end up long into a rejection.
What invalidates the base
The weekly loss is the warning worth taking seriously. A recovery that is up strongly on the month but down on the week is one that has stopped expanding, and the burden of proof shifts back to the buyers. If price loses the $1.65 neckline on a closing basis, the double-bottom read is dead and the $1.50 demand base becomes the target rather than the foundation. Below that, there is very little structure to lean on.
Between $1.65 and $1.90 there is no edge worth pressing. That is a 25-cent band on a sub-$2 asset — plenty of movement, no information. The trades that make sense here are at the boundaries: a reaction at the neckline with a defined stop, or a confirmed break of the gate with the retest as the entry.
TON has done the hard part, which is stopping the decline. The easy-looking part — actually converting a base into a trend — is where most recoveries quietly fail.
Access levels for the daily level maps, scenario updates and alerts are set out on Becoin.net Tariff Plans.
This is market analysis for educational purposes and is not investment advice. Crypto assets are volatile and trading carries risk of loss.

How Understanding Market Structure Saved My Day Trading
I remember the exact moment my trading account hit zero for the third time in a single month. It was a rainy Tuesday evening, and I was staring at a 1-minute chart on my laptop screen. The price had been moving up aggressively. It looked like a flawless rocket ship to the moon. I clicked […]

The Clock and the Candle: How I Stopped Guessing the Best Time to Trade Day Trading
I still remember the night I blew my third trading account. It was 11:30 PM. The house was completely quiet, the market charts on my screen were barely crawling, and I was forcing trades out of pure impatience. I kept staring at a flatline asset, placing one-minute positions, convinced that the market owed me a […]

Deriv vs Binomo for Low-Risk Trading in 2026: Which Platform Is Better for Safer Growth?
Most beginners enter trading with one simple goal: avoid blowing up their account in the first week. That is exactly why low-risk trading matters more than fast profits. Two platforms that constantly appear in beginner discussions are Deriv and Binomo. Both allow small deposits, short-term trading, and beginner-friendly access. But when your focus is protecting […]

Simple Daily Trading Routine for Consistency
Most traders do not fail because of strategy alone. They fail because they are random. They trade when emotional, skip planning, increase risk after losses, and ignore review sessions. Consistency in trading usually comes from routine more than prediction. A simple daily trading routine helps you stay disciplined, reduce emotional mistakes, and improve decision making […]

Best Broker for $10 Deposit (Tested Platforms – 2026)
If you are starting with a $10 deposit, choosing the wrong broker will cost you more than the market itself. Most platforms look similar, but execution speed, withdrawal behavior, and usability are very different in practice. This page is designed to help you make a fast, clear decision. No unnecessary details. Only tested platforms that […]

Best Capital Core Day Trading Strategy for 1-Minute and 5-Minute Trades
I did not build my short-expiry strategy on Capital Core from a perfect week, a flashy YouTube setup, or some “secret indicator” thread. I built it by making the same mistakes most traders make when they first touch 1-minute and 5-minute day trading. I entered too early. I forced trades because the candles looked exciting. […]