Super Micro Forecast: SMCI Coils Under $34 With $46 in View
The most divisive name in AI infrastructure
Few large caps split opinion the way Super Micro does. On one side is a company sitting in the middle of the AI server buildout with direct-liquid-cooling capability that hyperscalers actually need. On the other is a governance history that cost the stock its premium and left a permanent discount versus peers. The chart reflects that argument perfectly: a long, choppy base rather than the clean trend the underlying demand story might suggest.
What has changed over the past two quarters is the shape of the base. The lows are getting higher, the rejections at $34 are coming faster, and the range is narrowing. That is compression, and compression eventually resolves.
What the Super Micro forecast hinges on
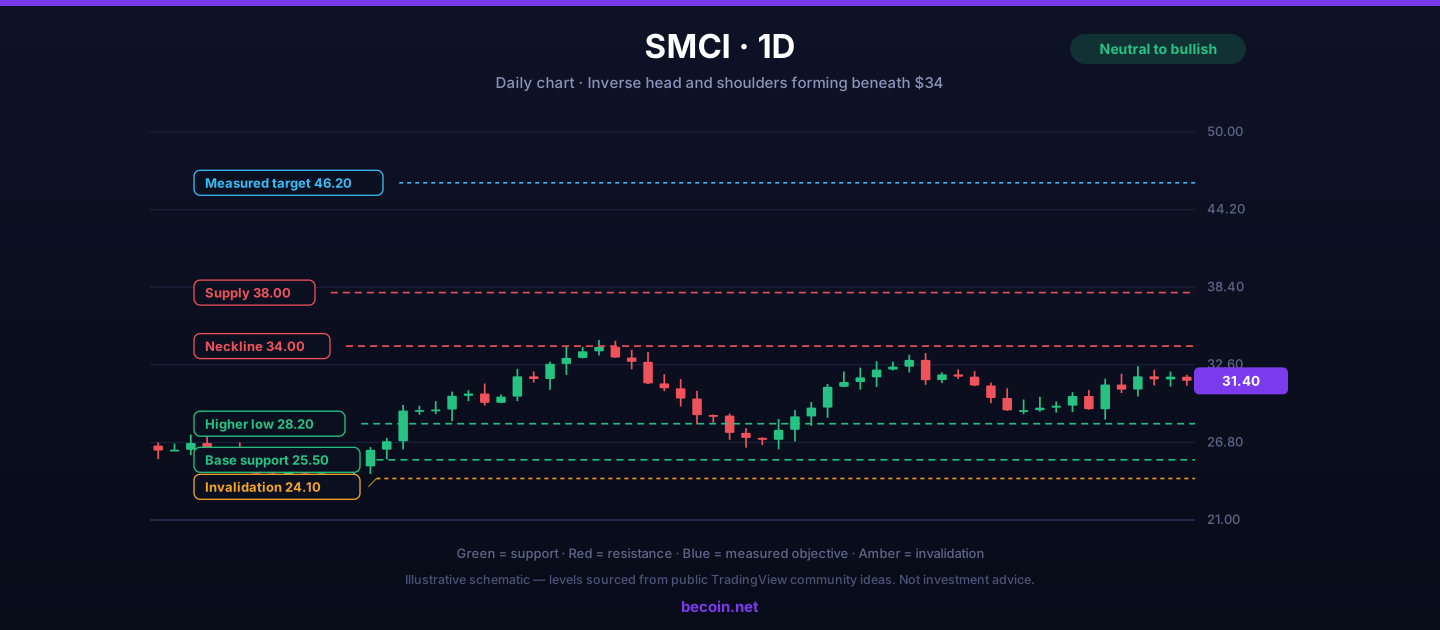
Four levels do the work:
- $25 to $26 is the base. It has been tested repeatedly and has held, which is the foundation of the entire constructive case.
- $28 to $28.50 is the more recent higher low and the shorter-term shelf worth defending.
- $34 is the neckline. It is the level that caps every rally and the one that turns this pattern into a trend if it breaks.
- $46.20 is the measured move from the base, with $38 an intermediate supply band along the way.
The bullish structure
An inverse head-and-shoulders has been forming across the base, with the neckline sitting at $34. The projection from that pattern points toward $46, and the fact that the right shoulder is holding higher than the left is a constructive detail rather than a cosmetic one.
The entry that makes sense is a pullback into $28 to $29 with invalidation beneath $24.10. That risks roughly five dollars for a first objective at the neckline and a second in the mid-$40s. The alternative is to wait for a daily close above $34.50 and enter on the retest, accepting the worse price for the better odds.
What confirmation looks like
Volume on the break matters more here than in most names because so much of the float has changed hands during the base. A neckline break on light volume in a stock with this history is exactly the kind of move that gets faded. A break with expanding volume and a hold above $34 for several sessions is the version worth trusting.
The bearish case
A daily close beneath $24.10 breaks the base and invalidates the pattern entirely. Beneath that, $21 is the last major shelf, and the move between the two would likely be quick because the base has attracted a large number of stops in exactly that zone.
The fundamental version of the bear case is margin compression. Server assembly is a competitive, low-margin business, and if pricing pressure from competitors intensifies while component costs stay high, revenue growth stops translating into earnings growth. That is the scenario that would keep the multiple depressed regardless of the chart.
The catalysts to watch
Quarterly earnings dominate, and this stock moves violently on them. Beyond that, watch hyperscaler capital expenditure guidance, GPU supply commentary from the chip vendors, and any further governance or filing news, which remains the single largest idiosyncratic risk.
Traders who want those catalysts tracked alongside the technical structure can follow the Becoin.net Premium Forecast for updated equity outlooks, and review the available access levels on the Becoin.net Tariff Plans page.
How to hold it
This is a name where position sizing should account for gap risk rather than average daily range. Overnight gaps of fifteen percent have happened more than once, and a stop placed beneath structure offers no protection against a gap through it. Sizing so that a gap to $21 is survivable, rather than sizing so that a stop at $24 is survivable, is the more conservative and more realistic approach.
Scale out into $34 on the first test rather than assuming the neckline breaks on the first attempt. Most necklines do not.
The bottom line
Super Micro is a long base with a clearly defined neckline at $34 and a measured objective in the mid-$40s. Above $34.50 on a daily close with volume, the pattern is live. Beneath $24.10 it is void. Everything between those numbers is the market still arguing.
This analysis is educational and does not constitute investment advice. Equity trading carries substantial risk of loss.

WTI reaches $89.43 as Brent clears $95 on renewed supply risk
WTI traded near $89.43 while Brent moved above $95 as Middle East shipping risk lifted crude for a fifth session. Key levels, catalysts and invalidation.

Finding the Best Trading Broker for Side Income: My Raw, First-Hand Journey to Consistent Daily Wins
Six months ago, I sat at my kitchen table staring at an accumulation of household bills, realizing my primary salary was no longer cutting it. I didn’t want a second job that required clocking into a physical location or taking endless boss mandates after hours. I needed a flexible, scalable side income. That night, I […]

Why Traders Move from Binomo to Deriv in 2026: The Real Reasons Behind the Switch
If you spend enough time around trading communities, you’ll notice a pattern. Many traders start with Binomo. Then, after a few months, a surprising number begin looking at Deriv. Some switch completely. Others keep both accounts but gradually move most of their trading activity to Deriv. I noticed this trend while talking to beginner traders […]

Which Broker Has the Cleanest Interface? Real Comparison for Beginners in 2026
Looking for the cleanest trading interface in 2026? Compare Binomo, IQ Option, Quotex, Deriv, and more based on speed, layout, usability, mobile experience, and beginner friendliness. When most beginners choose a broker, they focus on bonuses, payouts, or deposit methods. But after testing multiple platforms for months, I realized something surprising: A messy interface can […]

Which Broker Has Faster Withdrawals? Real 2026 Comparison for Traders
When most beginners choose a broker, they focus on bonuses, signals, or flashy interfaces. But after trading for a while, you realize one thing matters more than almost anything else: How fast can you actually withdraw your money? A broker can look perfect until your first withdrawal request gets stuck in “processing” for three days. […]

Is Capital Core Safe or a Scam? What Day Traders Should Know Before Depositing
I’ll be honest: the first time I landed on Capital Core, I didn’t feel excited. I felt suspicious. That might sound strange coming from someone who has spent years around day trading and offshore brokers, but if you’ve traded long enough, you know the pattern. A polished homepage. Big payout claims. A low minimum deposit. […]