Shopify Forecast: SHOP Turns Down From the 165 Zone
The rally arrived exactly where it was supposed to stop
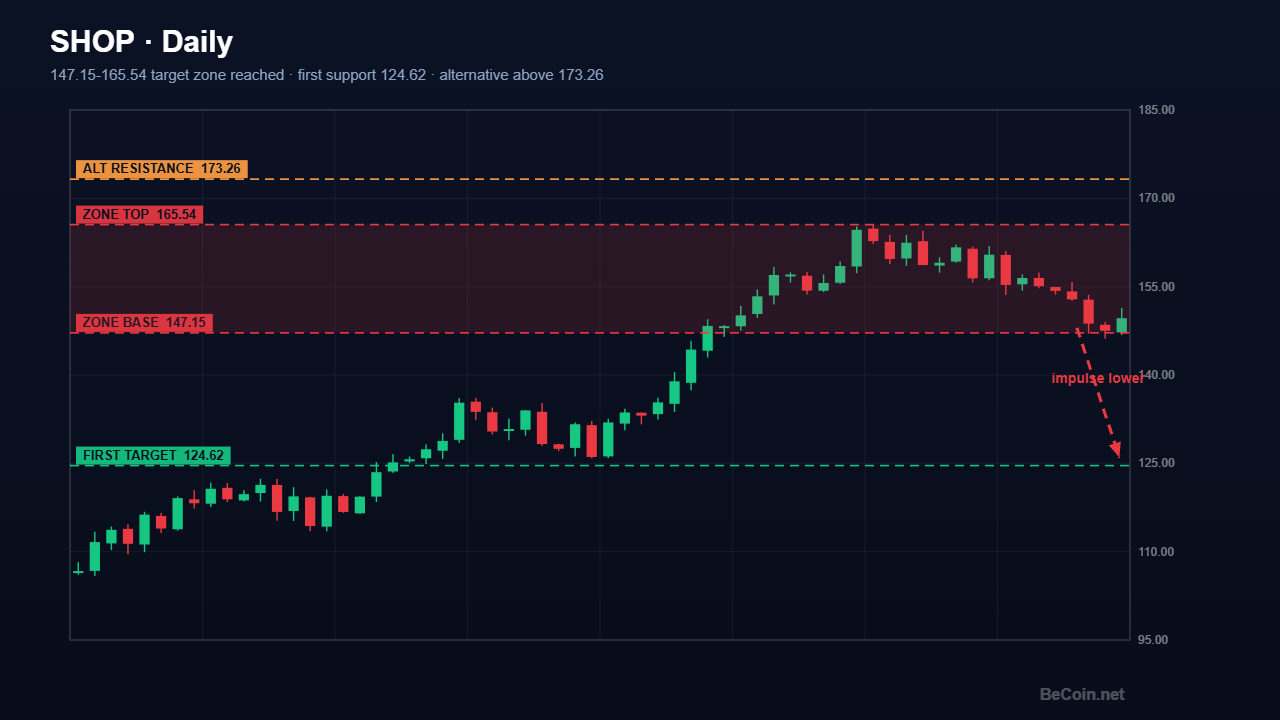
Shopify built genuine upward momentum into the 147.15 to 165.54 band, an area that had been mapped in advance as the logical ceiling for a corrective advance. Price entered the zone, spent time inside it, and has now started to turn lower. When a market reaches a projected level and reacts from it, the analysis has done its job. What follows is a different question entirely.
Shopify forecast: reading the turn
The working interpretation is that the advance into the zone was corrective rather than the start of a new trend, and that the stock has now begun a downward impulse. The immediate structural test is 124.62. That level supported the last consolidation, and a decisive move beneath it would confirm that the recovery attempt is finished rather than merely pausing.
Below that, the next area of interest sits considerably lower, near 85.65. That is not a forecast of where the stock will trade next week; it is where the structure points if the current impulse extends without interruption. Distant objectives like that are useful for framing the size of the potential move, not for timing anything.
The alternative deserves real weight
There is a credible scenario in which this read is wrong, and it carries meaningful probability rather than being a footnote. If SHOP pushes above 173.26 and holds it, the corrective advance is not complete; it is simply extending to a higher top. That would not immediately turn the chart bullish, but it would invalidate the current downside sequence and force a rebuild of the count.
Assigning roughly a one-in-three chance to the alternative is a healthy discipline. It stops the analysis becoming a belief and keeps the stop-loss where it belongs rather than where it feels comfortable.
Why the fundamentals do not settle it
Shopify's underlying business has continued to grow gross merchandise volume and expand its merchant services take rate, and the operating leverage story is real. The problem, as with much of high-growth software, is that the market has already paid for a lot of that growth. When a stock is priced for continued expansion, good results maintain the price rather than lifting it, and any deceleration gets punished disproportionately.
That dynamic is exactly why the chart is worth taking seriously here. Valuation cannot tell you when the repricing happens. Structure can at least tell you when the market has decided.
How to trade a zone rejection
The cleanest expression is to treat the top of the target zone as the risk boundary and 124.62 as the first objective, taking partial profit there rather than holding for the distant level. Rejections from supply zones tend to produce a sharp initial leg followed by a slower, choppier continuation, and traders who hold everything for the far target frequently give back the easy part of the move.
For anyone already long from lower levels, the practical question is simpler: does your thesis survive a close below 124.62? If not, that is where the position should be reduced, regardless of where it was entered.
Putting it together
Rejection at 147.15 to 165.54 is the signal. A close below 124.62 is the confirmation. A close above 173.26 is the cancellation. Everything between those levels is noise that will tempt you into acting early.
We track the large-cap growth names alongside the wider equity board, with levels revised as structure evolves, in the Becoin.net Premium Forecast. The access tiers and what each one covers are set out on Becoin.net Tariff Plans.
This is a technical framework rather than investment advice, and single-stock positions carry concentration risk that a chart cannot measure.

Chasing Safety in a High-Stakes World: My Quest for the Best Low-Risk Trading Platforms
I still remember the sinking feeling in my stomach when I lost my first tiny trading account. It wasn’t a massive fortune, but it was mine. That night, I realized a brutal truth about this industry: most beginners fail not because they lack passion, but because they dive into high-risk environments without a life jacket. […]

Best Broker for Pakistani Traders in 2026
Finding the best broker in Pakistan is not as simple as choosing the platform with the biggest ads or the highest payout percentage. Pakistani traders face unique challenges including payment method limitations, withdrawal delays, unstable strategies, and brokers that look attractive at first but become difficult to use later. Many beginners deposit money into the […]

$10 to $50 Trading Challenge – Strategy + Real Results (Case Study)
Turning $10 into $50 sounds easy until you actually try it. Small accounts expose every weakness in your trading. One bad decision can erase hours of progress, and emotional trading becomes much harder to control when every dollar matters. This case study breaks down how a $10 account was realistically grown to $50 using a […]

Binomo First $10–$50 Test Deposit Plan: The Safest Way to Validate the Platform Before Scaling
I didn’t start with confidence. I started with doubt. Every time I searched for answers about Binomo, I found opinions, not proof. Some people claimed fast withdrawals. Others complained about delays. But almost nobody showed a complete journey from deposit to withdrawal using real money. So I stopped reading and started testing. Instead of risking […]

Binomo Verification (KYC) for First Withdrawal: Exact Documents That Usually Trigger Rejection
The first time I tried to withdraw from Binomo, I was not worried about the trade. I was worried about the paperwork. That probably sounds strange if you are new. Most traders obsess over entries, expiry times, payout percentages, and strategy screenshots. I did too. But the moment I clicked my first withdrawal request, the […]
Binomo Deposit/Withdrawal: Why Using Different Payment Methods Causes Delays
The first time I hit a decent withdrawal on Binomo, I thought the hard part was over. I had done the trades. I had managed the risk better than usual. I had finally resisted the urge to overtrade after a win streak. So when I clicked withdraw, I expected the money to move as smoothly […]