Render Forecast: RENDER Climbs From $0.65 With $1.65 the First Gate
A recovery that has quietly become substantial
Render is trading at $1.4904, up 0.66% on the day, 9.74% on the week and 8.18% on the month. The year-to-date column reads plus 19.70%. Those are respectable numbers, and they look better still when measured from the October 2025 low of $0.65 — the token has more than doubled from that bottom.
The context that keeps this honest is the twelve-month figure: down 56.92%. And the all-time number is down 68.77% from the $13.65 peak set in March 2024. Render is recovering from a deep hole, not breaking out to new ground, and the difference matters for how much weight to put on the current move.
The accumulation base is well defined
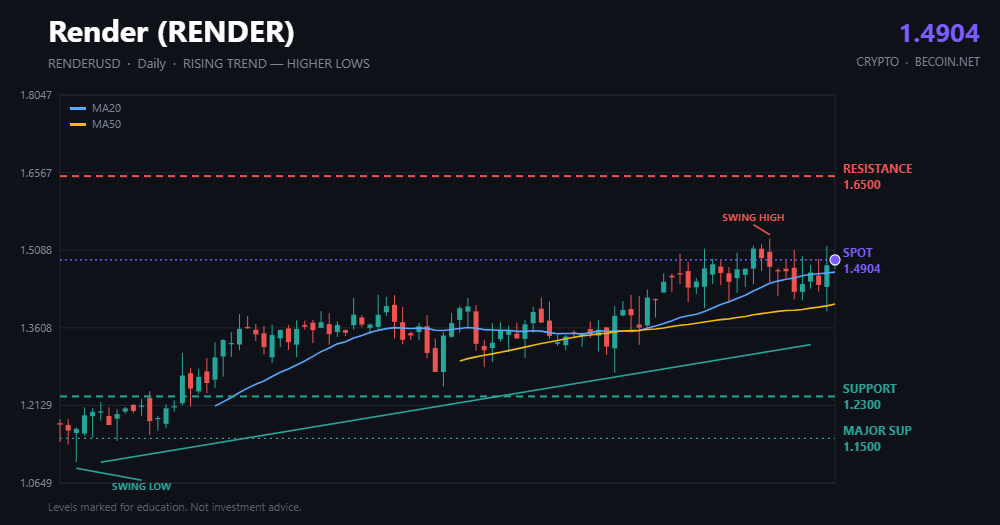
The zone that keeps getting referenced across public charts sits between $1.15 and $1.23, and it has behaved exactly like an accumulation range should: repeated tests, shrinking volume on each dip, and a series of higher lows since the token cleared it. That base is now roughly 20% below spot, which is a long way for a stop but a clean invalidation point for anyone treating this as a position trade rather than a swing.
With a market capitalisation of $798.6 million and a fully diluted figure of $991.63 million, Render sits at rank 64. Circulating supply of 518.77 million against a maximum of 644.17 million means roughly 80% of the eventual float is already in the market, which limits the unlock overhang that has weighed on comparable infrastructure tokens.
$1.65 is the level that decides the next phase
The first take-profit level that appears again and again in the accumulation setups is $1.65, followed closely by $1.70. Those are not arbitrary — they mark the underside of the range that broke down in mid-2025, and reclaiming that shelf would turn a recovery into a structural change. Above there the next references are $1.90 and then $2.50, which would represent a 68% move from spot.
Between $1.49 and $1.65 there is roughly 11% of clean air. That is the trade the current momentum supports. Everything beyond $1.90 requires a broader alt-market bid that is not visible yet, and the more excitable public targets of $4.10, $6.70 and higher belong to a different market regime than the one we are in.
What the fundamentals actually support
Render's pitch is decentralised GPU rendering, and its relevance rises and falls with the same AI-infrastructure narrative that drives the neocloud equities. That is a double-edged link: it gave the token its 2024 run and it took most of it back when the trade cooled. Daily volume of $39.89 million against a $798 million cap is thin enough that momentum moves both ways quickly.
Structured level coverage across the major infrastructure tokens runs through the Becoin.net Premium Forecast desk, and the plan comparison sits on the Becoin.net Tariff Plans page.
Render forecast: the levels to watch
Support: $1.23, then the $1.15 base floor, with the $0.65 October low as the structural bottom. Resistance: $1.65, then $1.70, $1.90 and $2.50. RENDER at $1.4904 is in the upper half of its recovery range with the first gate close enough to matter this month.

Which Broker Has Faster Withdrawals? Real 2026 Comparison for Traders
When most beginners choose a broker, they focus on bonuses, signals, or flashy interfaces. But after trading for a while, you realize one thing matters more than almost anything else: How fast can you actually withdraw your money? A broker can look perfect until your first withdrawal request gets stuck in “processing” for three days. […]

Deriv vs Binomo for Low-Risk Trading in 2026: Which Platform Is Better for Safer Growth?
Most beginners enter trading with one simple goal: avoid blowing up their account in the first week. That is exactly why low-risk trading matters more than fast profits. Two platforms that constantly appear in beginner discussions are Deriv and Binomo. Both allow small deposits, short-term trading, and beginner-friendly access. But when your focus is protecting […]

Which Is Easier for Beginners: Binomo or IQ Option?
For most beginners, the hardest part of trading is not strategy. It is surviving the first few months without blowing the account from emotional decisions, overtrading, and poor risk management. That is why choosing the right platform matters more than many new traders realize. Two names dominate beginner conversations in binary and short-term trading: Binomo […]

Is Capital Core Safe or a Scam? What Day Traders Should Know Before Depositing
I’ll be honest: the first time I landed on Capital Core, I didn’t feel excited. I felt suspicious. That might sound strange coming from someone who has spent years around day trading and offshore brokers, but if you’ve traded long enough, you know the pattern. A polished homepage. Big payout claims. A low minimum deposit. […]

Finding My Perfect Workspace: The Search for the Best Broker for My Daily Trading Routine
The alarm goes off at 6:00 AM. By 6:30 AM, I am sitting in front of my monitors with a steaming mug of black coffee. The house is completely quiet, the market is preparing its next major move, and my charts are completely bare. This is my daily sanctuary. For a long time, this morning […]

Which Broker Has the Cleanest Interface? Real Comparison for Beginners in 2026
Looking for the cleanest trading interface in 2026? Compare Binomo, IQ Option, Quotex, Deriv, and more based on speed, layout, usability, mobile experience, and beginner friendliness. When most beginners choose a broker, they focus on bonuses, payouts, or deposit methods. But after testing multiple platforms for months, I realized something surprising: A messy interface can […]