Pump.fun Forecast: PUMP Retests Support as $0.00278 Decides It
A token that lives and dies on activity
PUMP is not a chart you can read in isolation. The token is tied directly to the throughput of the launchpad that issues it, which means fee revenue, the pace of the buyback and the general appetite for speculation on Solana all feed into price far more directly than they do for a typical infrastructure token. When memecoin creation slows, the fundamental support disappears fast.
That is worth stating up front because the technical picture right now looks constructive, and it is easy to mistake a constructive chart for a durable one in a name this reflexive.
What the Pump.fun forecast rests on
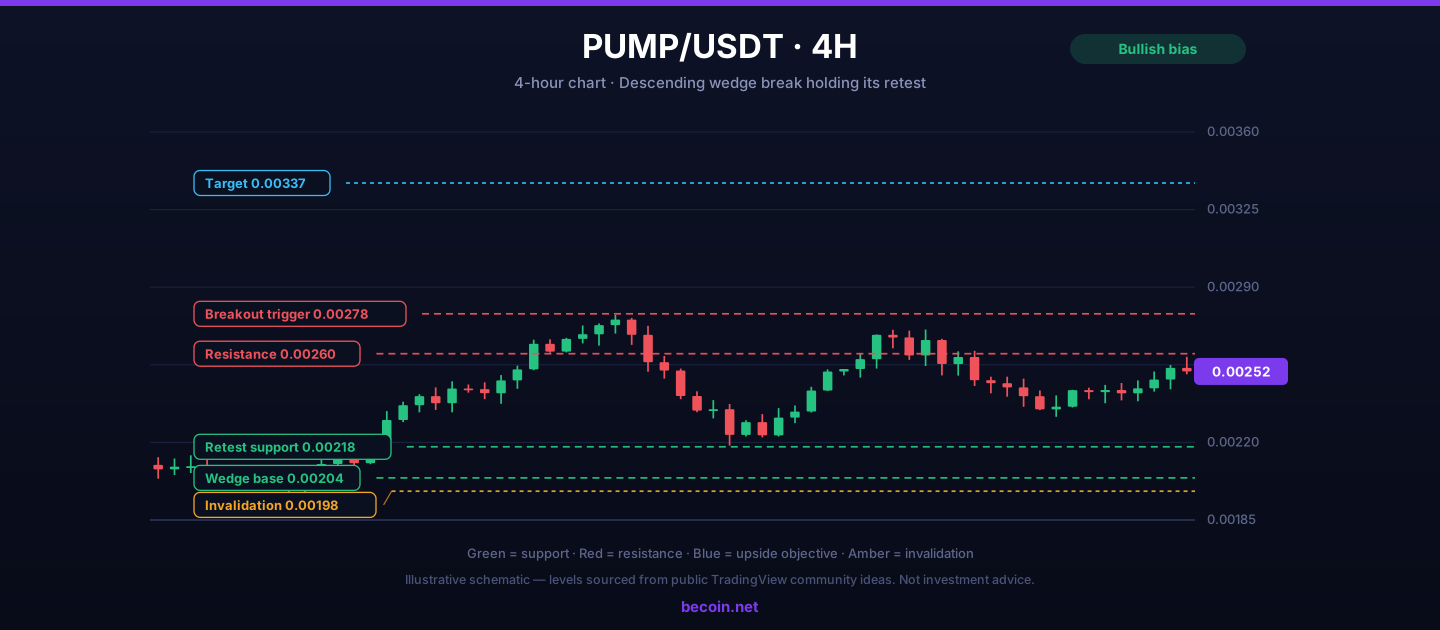
Price broke out of a multi-week descending wedge and has since pulled back to retest the breakout area rather than running away from it. That is textbook behaviour and, if the retest holds, generally the higher-quality entry.
- $0.00218 is the retest shelf. Holding it keeps the wedge break valid.
- $0.00204 is the wedge base and the last defence before the pattern fails outright.
- $0.00260 is the first band of resistance, where the initial thrust stalled.
- $0.00278 is the trigger. A four-hour close above it opens the measured move.
- $0.00337 is the projection from the wedge, and it aligns with an earlier distribution shelf.
The constructive path
The cleanest structure is to enter on the retest between $0.00220 and $0.00240 with invalidation beneath $0.00198. That risks roughly fifteen percent to target something closer to forty percent, which is the sort of asymmetry that justifies taking on a volatile name at all.
The second entry is the confirmed break of $0.00278. It is a worse price but a better probability, and for traders who cannot watch the market continuously it is usually the more sensible of the two.
Volume is the tell
Wedge breaks fail routinely when volume does not expand on the break. If price clears $0.00278 on volume similar to the preceding consolidation, treat it with suspicion. If it clears on a genuine expansion, the follow-through tends to be quick because there is very little overhead structure between there and the target.
What kills it
A four-hour close beneath $0.00198 invalidates the wedge and puts the prior lows back in play. Short ideas on this token have targeted the $0.00198 area specifically, so a break there is likely to accelerate rather than stabilise.
The other risk is slower and harder to trade around: a sustained decline in launchpad activity. If new token creation and trading volume fall for several consecutive weeks, the buyback that has been absorbing supply weakens, and the chart eventually reflects that regardless of the pattern.
Context matters more than usual here
This is a high-beta expression of Solana ecosystem risk appetite. It tends to outperform sharply when speculation is running hot and underperform brutally when it is not. Watching Solana itself, and the broader appetite for small-cap crypto, gives more early warning than watching the PUMP chart alone.
Traders who want that ecosystem view tracked alongside the levels can follow the Becoin.net Premium Forecast for updated digital asset projections, and review what each tier includes on the Becoin.net Tariff Plans page.
Sizing for something this volatile
A token that can move twenty percent in an afternoon needs a position size that reflects that. The practical approach is to decide the maximum dollar loss first, divide by the distance to invalidation, and take whatever position that math produces even if it feels too small to bother with. It will not feel too small during the first drawdown.
Take profit in thirds: one into $0.00260, one into $0.00278 if it stalls there, and let the final third run toward the measured move with a trailing stop. Holding the entire position for the full target in a name like this is a good way to watch an open profit evaporate.
The bottom line
PUMP has a valid wedge break holding its retest, a clear trigger at $0.00278 and a clear invalidation at $0.00198. The technical setup is defined. The fundamental driver behind it is not, and that asymmetry is the real risk in this trade.
This analysis is educational and does not constitute investment advice. Digital assets are highly volatile and carry substantial risk of loss.

How Liquidity Affects Day Trading Results
When I first started trading day trading, I believed success was all about finding the perfect indicator. I spent weeks testing moving averages, RSI settings, support and resistance levels, and dozens of YouTube strategies that promised easy wins. Some worked for a few trades, but most failed. What confused me was that the same setup […]

IQ Option vs Deriv Chart Comparison
The Night I Realized My Charts Were Lying to Me It was three in the morning, the exact hour when the market looks either like a goldmine or a psychological hazard. I was sitting in front of two monitors, a lukewarm mug of coffee in hand, watching a critical support level on EUR/USD. On my […]

Deriv vs Binomo Deposit Methods: My 2026 Real Money Comparison Guide
I sat in the corner of a crowded coffee shop, my eyes fixed on my phone screen. After months of testing strategies on a demo account, I had finally saved up a small pocket of risk capital. I felt ready to trade live. A high-probability setup was forming on my charts, and my heart rate […]

Binomo Demo vs Real Account: What Changes After You Deposit (KYC, Payout, Support, Limits)
I spent far too long thinking my Binomo demo results meant I was “ready.” On demo, everything felt clean. My entries looked sharp. My timing looked better than it probably was. I could reset virtual balance, test ideas, and convince myself I had control. Then I made my first real deposit, and that’s when I […]

Alphabet falls to $329.71 premarket as AI spending eclipses cloud growth
Alphabet traded near $329.71 premarket after strong Q2 revenue and cloud growth collided with a much larger AI spending plan. What investors need to watch.

Trading Currency Strength Instead of Single Pairs
It was a Tuesday afternoon when I realized I was fighting a losing battle against a ghost. My screen was a chaotic web of indicators. I had the EUR/USD chart open, a moving average crossing over here, a relative strength index flashing oversold there, and a price action setup that looked textbook perfect. I clicked […]