NVIDIA at 195-205: Is This Where Buyers Show Up Again, or Where the Story Cracks?
Strong stocks correct. That is not the news.
NVIDIA has come off its recent high and a familiar set of headlines has followed. The fall itself is unremarkable; leadership names give back ground routinely, and a pullback in a stock that has run this far is closer to normal than to alarming. What is worth studying is where the pullback stopped, and what price does now that it is there.
The NVIDIA demand zone in question
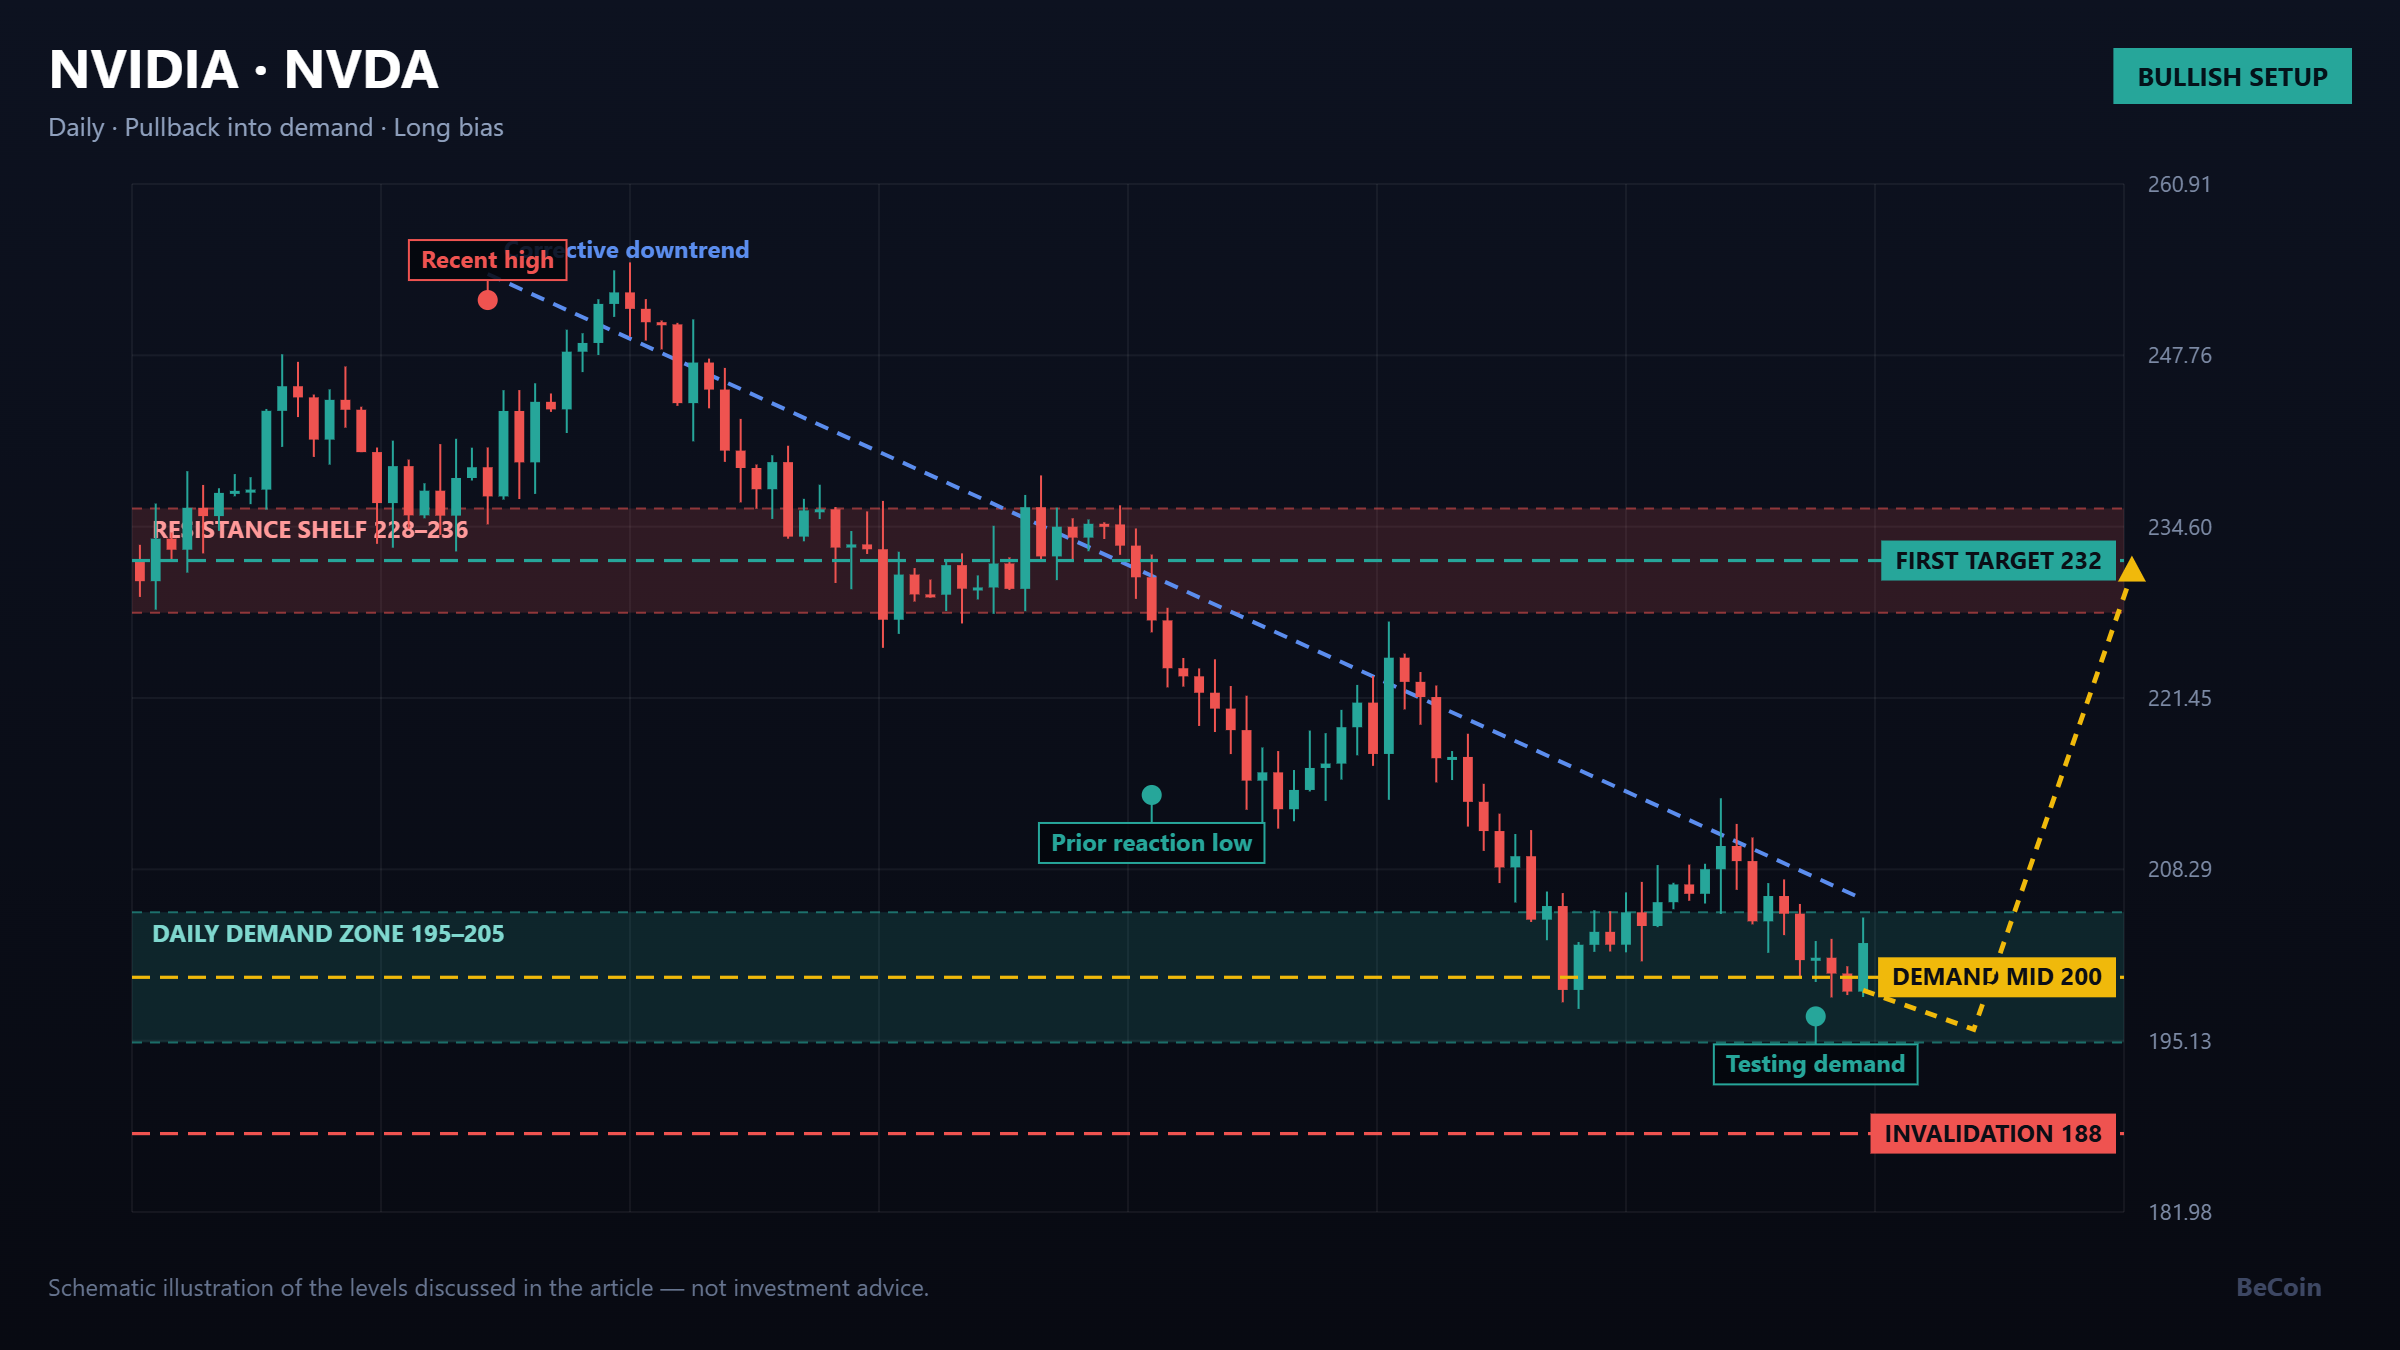
On the daily chart, NVIDIA has stabilised around the 195 to 205 area. This is not an arbitrary band. It sits on top of several earlier reactions where selling pressure visibly slowed and buyers stepped back in. Areas like this are worth marking because they represent a price the market has previously decided is attractive enough to defend.
A demand zone is not a guarantee. It is a place where a decision was made once before, and the only question that matters is whether the same decision gets made again. Marking the zone is analysis. Assuming it holds is prediction.
What confirmation would look like
The behaviour to watch for is straightforward. Long lower wicks into the zone with closes near the highs of the day suggest absorption. A cluster of narrow-range days with declining volume suggests supply has dried up. Either pattern, followed by a strong up day that reclaims the top of the zone, is the sequence buyers want.
The opposite is equally readable. Closes below 195 with volume expanding, and particularly a daily close under 188, would say the zone has failed. Failed demand zones tend to become resistance quickly, and the next real reference sits meaningfully lower.
The fundamental context
NVIDIA's position in the AI infrastructure build-out is the reason the stock is priced where it is, and it is also the reason pullbacks in it are treated as opportunities rather than warnings. That said, valuation compression is a real risk in any name that has re-rated this aggressively. The stock does not need bad news to fall; it only needs the pace of upgrades to slow.
This is why the technical level matters more than usual here. It gives a place to be wrong that does not depend on having a view about the next earnings cycle.
The upside map
If the zone holds, the first area of interest is the resistance shelf near 232, which capped the last attempt higher. Above that, the prior high comes back into range. The distance from 200 to 232 against a stop below 188 gives a workable ratio, which is more than can be said for chasing the stock at highs.
How to think about it
The framing that works is a conditional one. If NVIDIA defends 195 to 205 with visible buying, the pullback was a pause in an uptrend. If it loses 188 on a daily close, the pullback was the beginning of something larger and the correct response is patience rather than conviction. There is no need to decide in advance which it will be.
Bottom line
NVIDIA is testing a daily demand zone between 195 and 205 that has produced buying before. Confirmation of support opens 232 and then the prior high. A daily close below 188 invalidates the setup and shifts the burden of proof back to the bulls.
Becoin.net Premium Forecast - Becoin.net Tariff Plans
This article is educational market commentary and is not investment advice. Do your own research and manage risk accordingly.

Why Most Deriv Traders Blow Accounts: A Data-Driven Post-Mortem Analysis
The first time I blew a trading account on Deriv, it didn’t happen dramatically. There was no single catastrophic trade. It happened quietly. One loss turned into another. Then I increased the stake to recover the loss. Then the market moved again. Before I realized what had happened, an account balance that took weeks to […]

Binomo vs IQ Option for Small Accounts: Which Platform Is Better for Beginners in 2026?
Most people entering online trading do not start with thousands of dollars. They start small. Usually with $10, $20, or maybe $50. That small balance changes everything about how a trader behaves. Every loss feels bigger, every win feels emotional, and every mistake has a stronger impact on the account. This is exactly why beginner […]

Trading Currency Strength Instead of Single Pairs
It was a Tuesday afternoon when I realized I was fighting a losing battle against a ghost. My screen was a chaotic web of indicators. I had the EUR/USD chart open, a moving average crossing over here, a relative strength index flashing oversold there, and a price action setup that looked textbook perfect. I clicked […]

The Clock and the Cash: My Journey into the Hidden Rhythm of Session-Based Trading
There was a time when I thought the global financial market was a single, monstrous wave that never stopped moving. I believed that if I sat in front of my monitors long enough, clicking buttons whenever a pretty pattern appeared on my charts, the market would eventually reward my sheer endurance. I was dead wrong. […]

The Day I Stopped Trading and Finally Started Making Money
It was a rainy Tuesday morning, and I was staring at my screen with a familiar knot in my stomach. The previous three days had been a slow, agonizing slide into the red. I had given back two weeks of hard-earned profits in less than seventy-two hours. Every asset I clicked on looked like a […]

Finding the Best Trading Broker for Side Income: My Raw, First-Hand Journey to Consistent Daily Wins
Six months ago, I sat at my kitchen table staring at an accumulation of household bills, realizing my primary salary was no longer cutting it. I didn’t want a second job that required clocking into a physical location or taking endless boss mandates after hours. I needed a flexible, scalable side income. That night, I […]