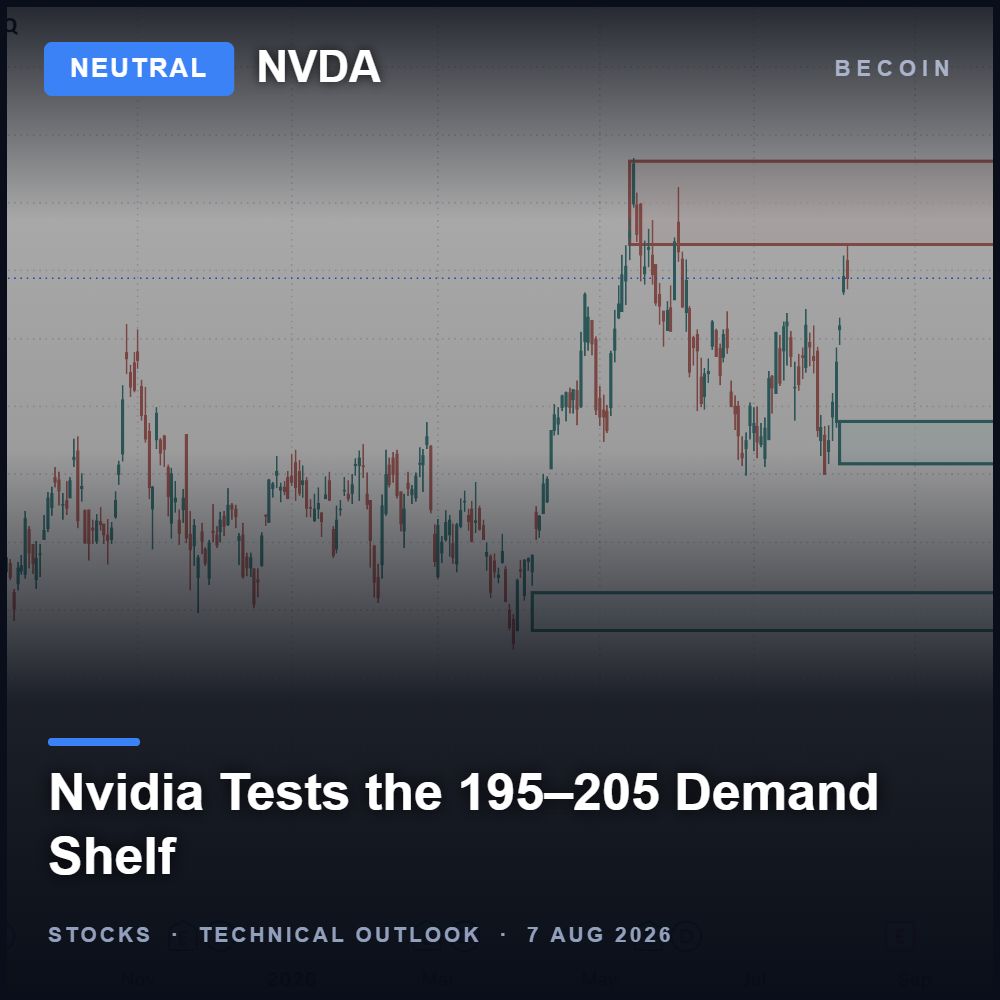
Nvidia Settles Into the 195–205 Demand Zone — Is the Selling Running Out?
Back to a level that mattered before
Nvidia has pulled back from its recent high and is now stabilizing around the 195 to 205 region on the daily chart. This is not an arbitrary area. It overlaps several earlier reactions where selling slowed and buyers re-engaged, which is what makes it a higher-timeframe demand zone rather than just a place price happens to be. The relevant question is not that the stock has fallen — strong stocks correct routinely — but how it behaves now that it has returned to ground buyers previously chose to defend.
What a demand zone actually tells you
Zones like this do not guarantee reversals. They simply mark the price at which the market last decided the stock was attractive enough to buy in size. When price comes back, participants get to make that decision again with new information. That framing comes from a chart study and it is a more honest way to use support than treating it as a floor.
The fundamentals are not the problem
Nvidia reported quarterly revenue of $81.6 billion, up roughly 85 percent year over year, with the data centre segment still doing the heavy lifting and management guiding for further growth. That is not the profile of a business in trouble. But a strong company and a rising share price are different things. Nvidia has been priced for exceptional execution for a long time, which creates the awkward situation where the company can keep delivering while the stock still struggles, simply because expectations were already extraordinary.
What the pullback might really be about
Viewed that way, the correction is probably not the market questioning Nvidia's position in artificial intelligence. It looks more like the market renegotiating what that position is worth at a given multiple. Those repricings can take time and can travel further than the fundamentals appear to justify, which is why chart structure is more useful than narrative in this phase.
What would confirm a base
Holding above the demand zone is necessary but not sufficient. The first genuine improvement would be a sequence of higher lows building on the daily chart, showing that each dip is being bought earlier than the last. Stronger confirmation would come from reclaiming the resistance overhead that has been capping recovery attempts. Until at least the first of those appears, this is a stock in a demand zone, not a confirmed reversal.
Bottom line
Nvidia is testing the area where buyers have shown up before, with fundamentals that remain robust and a valuation debate that remains unresolved. Higher lows would be the first sign the selling has exhausted; a decisive break below the zone would say otherwise. This is analysis, not investment advice.

Chasing Safety in a High-Stakes World: My Quest for the Best Low-Risk Trading Platforms
I still remember the sinking feeling in my stomach when I lost my first tiny trading account. It wasn’t a massive fortune, but it was mine. That night, I realized a brutal truth about this industry: most beginners fail not because they lack passion, but because they dive into high-risk environments without a life jacket. […]

Which Broker Has Better Risk Management Tools?
The burning smell of my own account blowing up is a scent I will never forget. It was a rainy Tuesday afternoon a few years back. I sat huddled over my laptop, watching a currency pair oscillate. Confident, arrogant, and entirely unprotected, I clicked buy. Minutes later, a sudden market spike completely wiped out my […]

Best Broker for Pakistani Traders in 2026
Finding the best broker in Pakistan is not as simple as choosing the platform with the biggest ads or the highest payout percentage. Pakistani traders face unique challenges including payment method limitations, withdrawal delays, unstable strategies, and brokers that look attractive at first but become difficult to use later. Many beginners deposit money into the […]

Top 3 Trading Platforms That Actually Pay (Proof-Based)
Choosing the wrong broker at the start is where most traders fail. Not because they lack strategy but because they end up stuck with slow withdrawals, poor execution, or confusing platforms that break decision flow. If your goal is to find the best trading platform for small deposit or the best broker for beginners, you […]
Capital Core Verification Process Explained: KYC, Restrictions, and Withdrawal Delays
I learned something the hard way with offshore-style brokers: the smoothest part is usually opening the account, funding it, and placing the first few trades. The real test starts when you try to move money back out. That’s exactly why I wanted to document the Capital Core verification process from a trader’s perspective, not from […]

The Clock and the Candle: How I Stopped Guessing the Best Time to Trade Day Trading
I still remember the night I blew my third trading account. It was 11:30 PM. The house was completely quiet, the market charts on my screen were barely crawling, and I was forcing trades out of pure impatience. I kept staring at a flatline asset, placing one-minute positions, convinced that the market owed me a […]