Nifty 50 Grinds Higher Toward Its 200 Day Average
Where the index stands
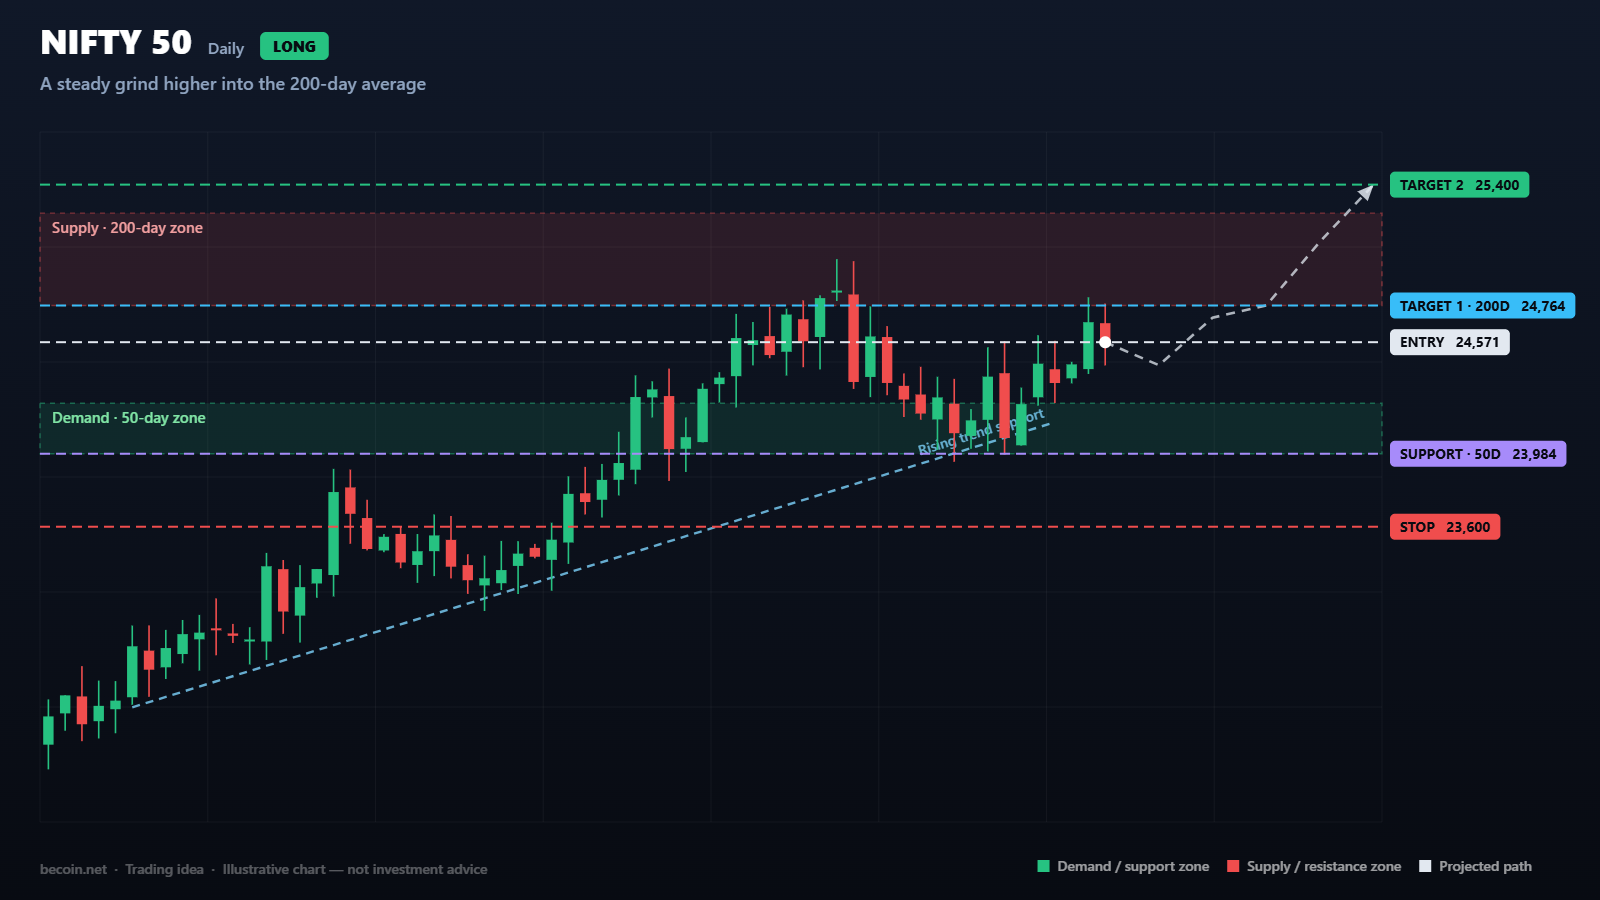
The Nifty 50 is trading near 24,571 after recovering from the 22,183 low. The advance has been slow and persistent rather than sharp, which is generally the more durable kind. Price sits above the 50-day average at 23,984 and is now within about one percent of the 200-day at 24,764, which is the level that will decide whether this is a bounce or a genuine trend change.
Momentum sits at a daily RSI near 60. That is healthy territory: strong enough to confirm buyers are in control, not so strong that the market is obviously overextended.
What the chart is showing
The recovery has traced a clean sequence of higher lows, and the line connecting them now runs close to 24,150. Every dip during the advance has been shallow and short-lived, and the index has not closed below its 50-day average in several weeks. That kind of consistency is what separates a real recovery from a relief rally.
Above the market, the 24,764 to 25,250 band is where the 200-day average sits and where the index spent time before the decline. That combination of a moving average and old supply in the same zone makes it a natural place for the advance to pause.
Levels that matter
Support is 23,984 at the 50-day average, with the rising trendline just above it near 24,150. Below that, 23,600 is the level that would break the sequence of higher lows.
Resistance is 24,764 first, then 25,400. The 52-week high at 26,373 is the longer-term objective if the 200-day gives way convincingly.
How the idea could play out
The base case is continuation into the 200-day average, a period of consolidation there, and then a resolution. Buying pullbacks toward 24,150 to 24,250 with a stop below 23,600 gives roughly 600 points of risk against 500 points to the first target and 1,200 to the second. The second target is where the trade earns its keep, so this is a position to hold through some chop rather than to take off quickly.
Buying at current levels is workable but less attractive, since the first target sits only 200 points away while the stop is 950 points below. The trend is friendly; the entry price still matters.
What would invalidate it
A daily close below 23,600 breaks the higher-low structure and would suggest the recovery has failed. Short of that, a sharp rejection at 24,764 that leads back through the 50-day average would mean the index is building a range rather than continuing higher, which calls for patience rather than persistence.
Managing the position
Indian equities are influenced heavily by foreign institutional flows, the rupee, and domestic policy announcements, and the index can gap on news that breaks outside cash-market hours. Traders using derivatives should also account for expiry-week volatility, which routinely produces moves that have nothing to do with the underlying technical picture.
Taking partial profit at the 200-day average and trailing the balance beneath the rising trendline is a straightforward way to participate without needing to predict the outcome at 24,764.
The bottom line
The Nifty 50 has quietly rebuilt a constructive structure, and the next few sessions at the 200-day average will say a lot about how much further it can go. The trend deserves the benefit of the doubt while 23,600 holds, and the levels are clear enough that there is no need to guess.
Becoin.net Premium Forecast - Becoin.net Tariff Plan
This analysis is a technical study prepared for educational purposes. It is not investment advice, and no outcome described here is guaranteed. Trade only with capital you can afford to lose.

Bitcoin slips to $65,741 as oil and yields test the breakout
Bitcoin is near $65,741 as rising oil and Treasury yields test the $65.7K breakout floor. Here are the levels that confirm or invalidate the move.

Trading Currency Strength Instead of Single Pairs
It was a Tuesday afternoon when I realized I was fighting a losing battle against a ghost. My screen was a chaotic web of indicators. I had the EUR/USD chart open, a moving average crossing over here, a relative strength index flashing oversold there, and a price action setup that looked textbook perfect. I clicked […]

How Liquidity Affects Day Trading Results
When I first started trading day trading, I believed success was all about finding the perfect indicator. I spent weeks testing moving averages, RSI settings, support and resistance levels, and dozens of YouTube strategies that promised easy wins. Some worked for a few trades, but most failed. What confused me was that the same setup […]

Deriv vs IQ Option for Beginners in 2026: Which Platform Is Better to Start With?
Choosing your first trading platform can decide whether you stay consistent or quit after blowing your first account. Most beginners do not fail because trading is impossible. They fail because they start on platforms that confuse them, encourage emotional trading, or make risk management difficult. Two names that often appear in beginner discussions are Deriv […]

Best Day Trading Brokers for Beginners (2026) — Fast Decision Guide
If you’re searching for the best day trading brokers for beginners, the real problem isn’t lack of options, it’s choosing the wrong platform and learning that mistake after you deposit. Most beginners don’t fail because of strategy. They fail because they start on a broker that has unclear execution, weak withdrawal behavior, or confusing conditions. […]

Is Capital Core Safe or a Scam? What Day Traders Should Know Before Depositing
I’ll be honest: the first time I landed on Capital Core, I didn’t feel excited. I felt suspicious. That might sound strange coming from someone who has spent years around day trading and offshore brokers, but if you’ve traded long enough, you know the pattern. A polished homepage. Big payout claims. A low minimum deposit. […]