Hyperliquid Forecast: HYPE Leans on $38 With $50 the Real Test
A perpetual exchange token that trades like a growth stock
Hyperliquid occupies an unusual position in this cycle. It is one of the few tokens where the underlying business is measurable in real time: perpetual futures volume, fee revenue and the buyback that revenue funds. That gives HYPE a fundamental anchor most altcoins lack, and it explains why the chart has behaved more like a high-beta equity than a typical speculative token.
It also explains the current standoff. Price has been carving out a rising channel off the mid-$30s while running into consistent supply in the high $40s. Buyers are treating dips as accumulation; sellers are treating rallies into $50 as distribution. Neither side has won yet.
What the Hyperliquid forecast turns on
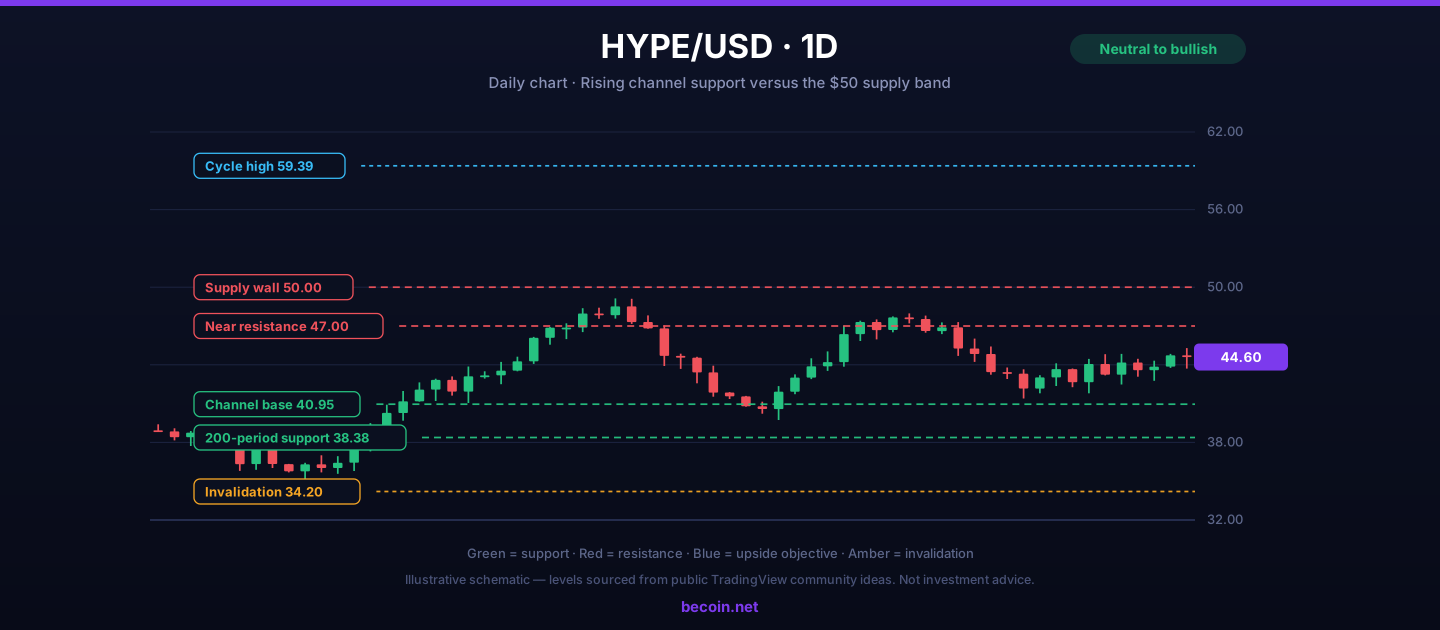
Five levels frame everything:
- $38.38 is the long-term average that has caught every meaningful pullback in this leg. Losing it on a daily close is the first real warning.
- $40.95 is the rising channel base and the shorter-term line in the sand.
- $45 to $47 is the first band of resistance, where several recent rallies have stalled before reaching the main wall.
- $48 to $50 is the supply wall. It is the level that defines whether this is a base or a ceiling.
- $59.39 is the prior cycle high and the natural magnet if $50 gives way.
The bullish case
The constructive path is straightforward: hold $40.95, build a higher low above $42, then close a daily candle above $50 on expanding volume. That sequence would confirm the rounding structure that has been forming since the summer and would put the mid-$50s in play quickly, with the old high as the larger objective.
The reason the volume condition matters is that HYPE has produced several low-conviction pokes into the high $40s already. Each one failed because there was no participation behind it. A break that matters will look different on the volume profile, not just on the price axis.
Where the entries live
Two zones offer defined risk. The first is a pullback into $41 to $42.6 with invalidation beneath $40, which is a tight structure with roughly $6 of upside to the first resistance band. The second is the retest of $50 from above after a confirmed break, which is a lower-probability entry to catch but a much cleaner one to hold.
The bearish case
If $38.38 breaks on a daily close, the channel is gone and the market is back in the wide $25 to $38 zone that dominated earlier in the year. That is a genuinely different regime, and it usually coincides with falling exchange volume, which would undercut the fundamental story at the same time as the technical one.
The deeper supports beneath that are thin. $34 has some historical significance and $25 is the last major shelf. Anyone who thinks of this as a dip-buying opportunity should be honest about the distance between those levels.
What actually drives it
Three inputs matter more than sentiment: perpetual volume on the exchange itself, the pace of the fee-funded buyback, and overall crypto risk appetite as proxied by Bitcoin dominance. When Bitcoin consolidates quietly, high-beta names like this one outperform. When Bitcoin breaks down, correlation goes to one and the fundamentals stop mattering for a few weeks.
Traders who want those inputs tracked alongside the level work can follow updated digital asset projections through the Becoin.net Premium Forecast and compare access options on the Becoin.net Tariff Plans page.
Managing risk in a high-beta name
HYPE can move ten percent in a session without any news. Position sizes that feel comfortable on a major will feel reckless here within a week. A practical rule is to size the position by the dollar distance to invalidation rather than by the notional amount, and to accept that this means a much smaller position than intuition suggests.
Take partial profit into $47 rather than waiting for $50. Supply walls exist because sellers are waiting there, and the difference between exiting at $47 and getting rejected back to $42 is the difference between a good month and a flat one.
The bottom line
Hyperliquid is a base with a hard ceiling. Above $50 on a daily close it becomes a trend with the old high in view. Beneath $38.38 it becomes a broken channel with a lot of air underneath. Between those numbers, trade the edges and keep the size honest.
This analysis is educational and does not constitute investment advice. Digital assets are highly volatile and carry substantial risk of loss.

Bitcoin slips to $65,741 as oil and yields test the breakout
Bitcoin is near $65,741 as rising oil and Treasury yields test the $65.7K breakout floor. Here are the levels that confirm or invalidate the move.

I Started with $10 on Quotex – Day 1 Results (Real Case Study)
Most beginner traders ask the same question:Can you actually grow a small account like $10? Instead of theory, I decided to test it in real conditions. This is a Day 1 case study of trading with $10 on Quotex, documenting everything from setup to execution, mistakes, emotions, and actual results. No hype, no fake screenshots, […]

WTI reaches $89.43 as Brent clears $95 on renewed supply risk
WTI traded near $89.43 while Brent moved above $95 as Middle East shipping risk lifted crude for a fifth session. Key levels, catalysts and invalidation.

Why Traders Move from Binomo to Deriv in 2026: The Real Reasons Behind the Switch
If you spend enough time around trading communities, you’ll notice a pattern. Many traders start with Binomo. Then, after a few months, a surprising number begin looking at Deriv. Some switch completely. Others keep both accounts but gradually move most of their trading activity to Deriv. I noticed this trend while talking to beginner traders […]

Which Broker Has Faster Withdrawals? Real 2026 Comparison for Traders
When most beginners choose a broker, they focus on bonuses, signals, or flashy interfaces. But after trading for a while, you realize one thing matters more than almost anything else: How fast can you actually withdraw your money? A broker can look perfect until your first withdrawal request gets stuck in “processing” for three days. […]

Fastest Withdrawal Brokers (Real Test Results)
The first time I made a profitable trade, I wasn’t thinking about strategy anymore. I was thinking about one thing. Can I actually withdraw this? I requested my payout and waited. And waited. That “processing” label stayed there longer than my trade itself. That moment changed how I evaluate brokers. Since then, I’ve made it […]