Hang Seng Runs Into Its 200 Day Line at a Decision Point
Where the index stands
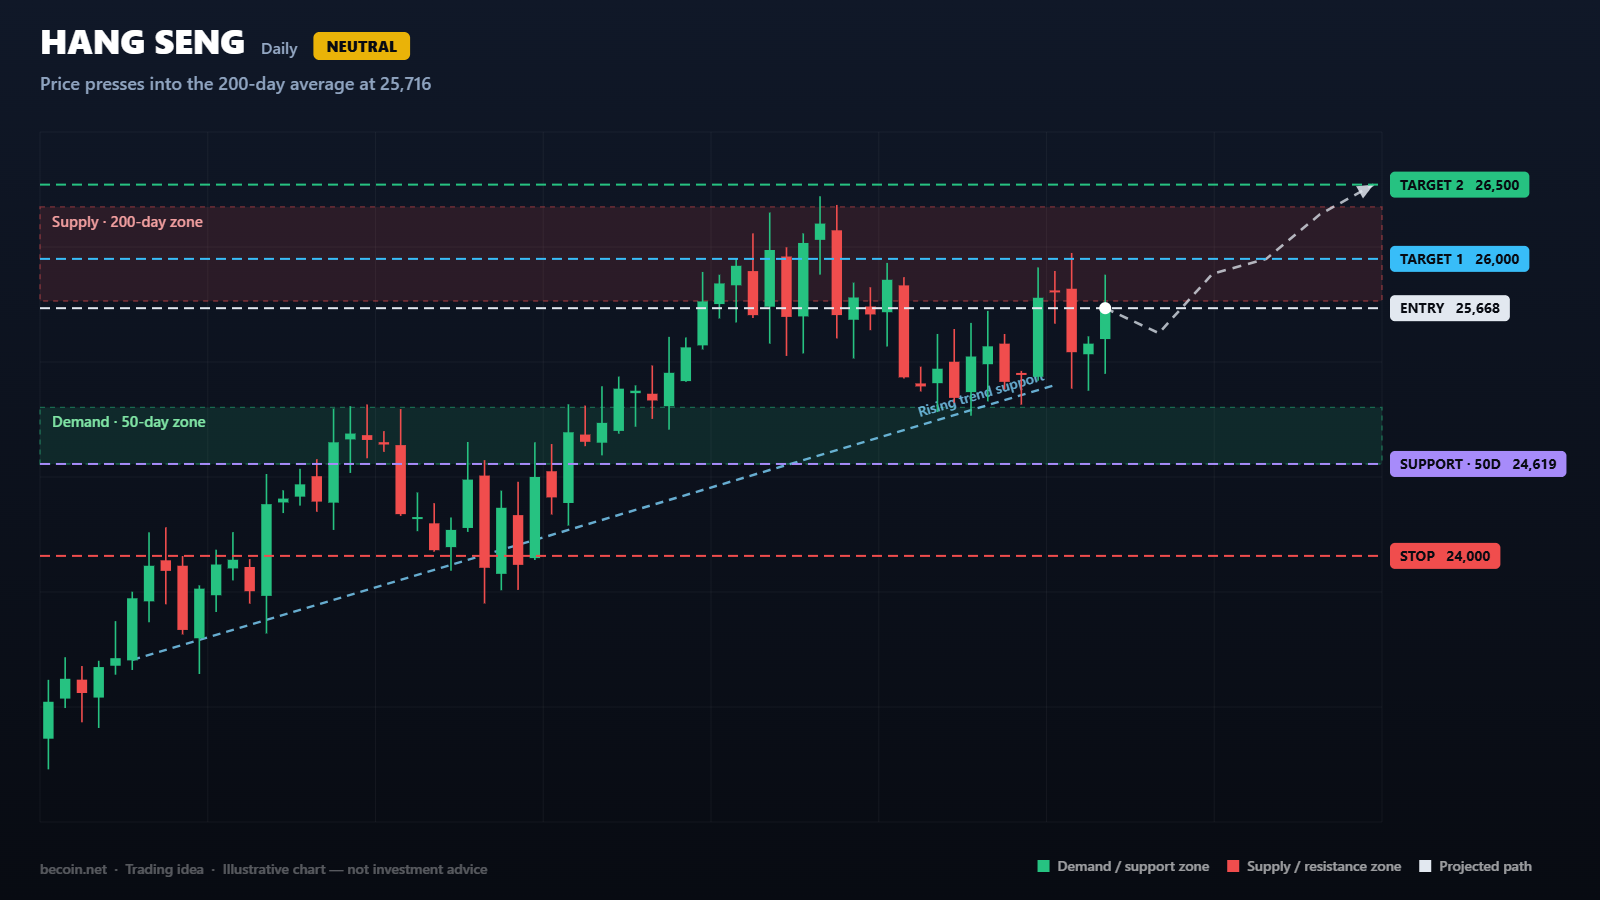
The Hang Seng is trading around 25,668 after recovering from the 22,518 low earlier in the year. That advance has carried the index back above its 50-day average at 24,619 and has now brought it right to the 200-day average at 25,716. Price is effectively sitting on the line that separates a recovery from a trend change, which is what makes this a genuine decision point rather than a routine session.
Momentum is firm without being extreme, with the daily RSI near 59. That reading is consistent with a market that has been rewarded for buying dips and has not yet run into serious trouble.
What the chart is showing
The recovery has followed a rising line drawn across the swing lows, which now sits close to 25,150. Each pullback during the advance has been bought within a few sessions, and the index has not spent meaningful time below its 50-day average since the base formed.
The obstacle is what happens at the 200-day. Indices approaching a declining or flattening 200-day average from below very often stall there for weeks, and traders who buy the first touch are frequently stopped out before the level eventually gives way. The more reliable signal is not the touch itself but what happens on the retest afterwards.
Levels that matter
Resistance begins at 25,716 and runs up to roughly 26,350, where the last distribution took place. Above that, 26,500 is the round-number objective and the 52-week high at 28,056 is the longer-term reference.
Support sits at 24,619 at the 50-day average, with the rising trendline close by. Below that, 24,000 is the level that would call the whole recovery into question.
How the idea could play out
The constructive path is a close above 25,716 followed by a successful retest, which would open 26,000 and then 26,500. Buying that retest with protection below 24,619 gives roughly 1,000 points of risk against 800 points to the first target and 1,300 to the second. The ratio is unremarkable, which argues for using the 200-day break as a signal to be patient rather than aggressive.
The alternative approach is to wait for the index to pull back to the 50-day average and buy there instead, accepting a wider stop but a much better entry. Both are legitimate; they simply suit different temperaments.
What would invalidate it
A clear rejection at the 200-day that produces a close back below 25,000, followed by a break of 24,619, would mean the recovery has stalled and the larger downtrend is reasserting itself. A close below 24,000 would confirm it.
Managing the position
Hong Kong equities are unusually sensitive to policy news out of Beijing and to shifts in global risk appetite, and much of that news arrives outside local trading hours. Gap risk is a real feature of this market rather than an occasional inconvenience, and stops should be set with that in mind. Position sizing that assumes an overnight gap through the stop is more realistic than sizing that assumes an orderly exit.
Taking partial profit at 26,000 and moving the balance to break-even is a sensible way to handle a trade that depends on a single well-known level.
The bottom line
The Hang Seng has done the work required to get back to its 200-day average. Whether it can get through it is a different question, and the answer will determine whether this is a recovery within a downtrend or the start of something more durable. The levels are clear enough that neither outcome needs to be guessed at in advance.
Becoin.net Premium Forecast - Becoin.net Tariff Plan
This analysis is a technical study prepared for educational purposes. It is not investment advice, and no outcome described here is guaranteed. Trade only with capital you can afford to lose.

Best Day Trading Brokers for Beginners (2026) — Fast Decision Guide
If you’re searching for the best day trading brokers for beginners, the real problem isn’t lack of options, it’s choosing the wrong platform and learning that mistake after you deposit. Most beginners don’t fail because of strategy. They fail because they start on a broker that has unclear execution, weak withdrawal behavior, or confusing conditions. […]

The Day I Stopped Trading and Finally Started Making Money
It was a rainy Tuesday morning, and I was staring at my screen with a familiar knot in my stomach. The previous three days had been a slow, agonizing slide into the red. I had given back two weeks of hard-earned profits in less than seventy-two hours. Every asset I clicked on looked like a […]

Deriv vs IQ Option for Beginners in 2026: Which Platform Is Better to Start With?
Choosing your first trading platform can decide whether you stay consistent or quit after blowing your first account. Most beginners do not fail because trading is impossible. They fail because they start on platforms that confuse them, encourage emotional trading, or make risk management difficult. Two names that often appear in beginner discussions are Deriv […]

Simple Daily Trading Routine for Consistency
Most traders do not fail because of strategy alone. They fail because they are random. They trade when emotional, skip planning, increase risk after losses, and ignore review sessions. Consistency in trading usually comes from routine more than prediction. A simple daily trading routine helps you stay disciplined, reduce emotional mistakes, and improve decision making […]

Is Capital Core Safe or a Scam? What Day Traders Should Know Before Depositing
I’ll be honest: the first time I landed on Capital Core, I didn’t feel excited. I felt suspicious. That might sound strange coming from someone who has spent years around day trading and offshore brokers, but if you’ve traded long enough, you know the pattern. A polished homepage. Big payout claims. A low minimum deposit. […]

EUR/USD holds 1.1414 before the ECB decision: three scenarios
EUR/USD traded near 1.1414 before the ECB’s July decision. Here is what a hold, hawkish hold or surprise hike could mean for 1.1350 and 1.1480.