EUR/USD Forecast: The 1.1620 Shelf Decides the Jackson Hole Reaction
A quiet tape hiding an argument
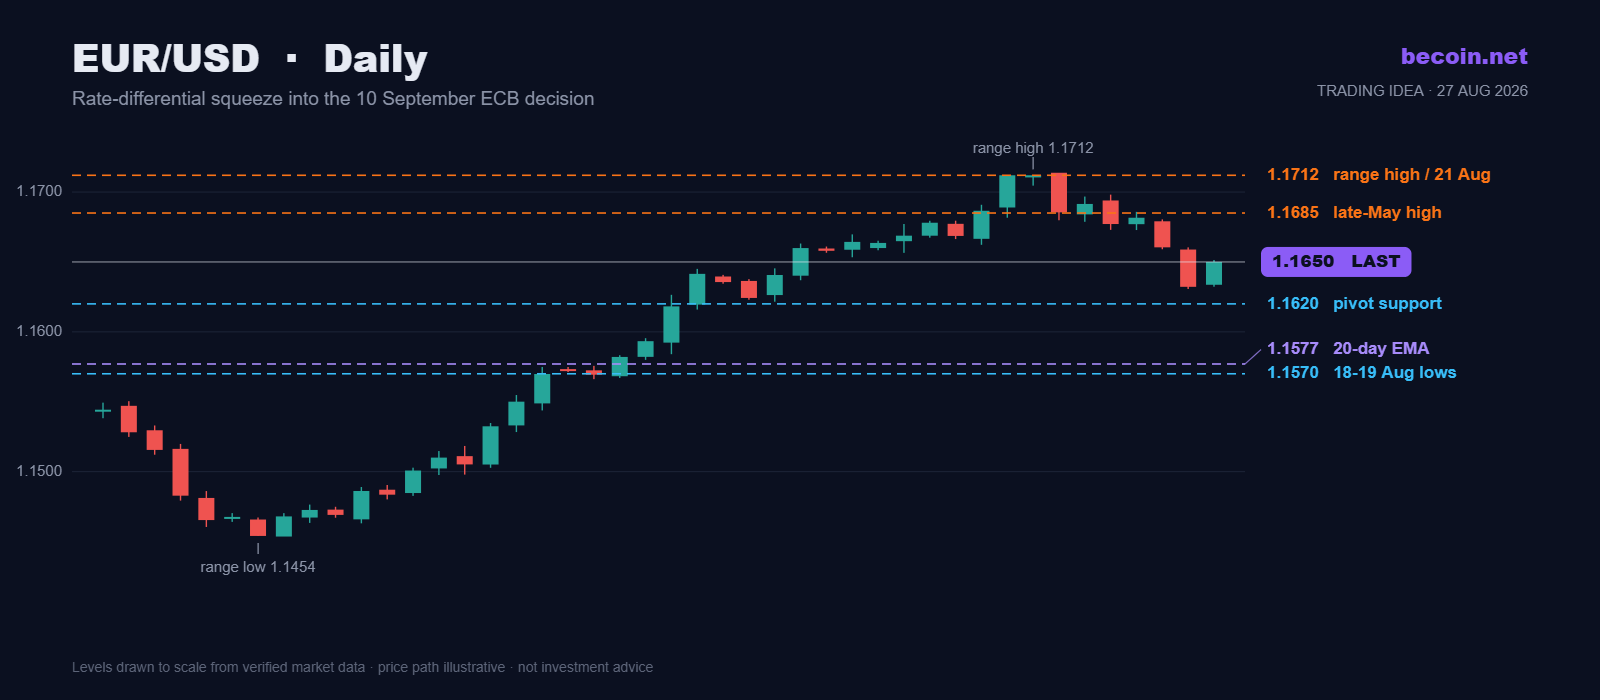
EUR/USD is trading around 1.1650 on 27 August, and the calm is deceptive. The pair spent August climbing from 1.1454 to 1.1712 — a 210-pip run that put it at its best levels since mid-May — and has now stalled into a narrow drift while the entire currency market waits on one speech. Underneath that stillness sits one of the cleaner macro setups in G10 right now, and it hinges on a level barely 30 pips below spot.
The bull case here is not sentiment. It is arithmetic. The ECB is widely expected to lift its deposit rate to 2.50% on 10 September, with market pricing somewhere between 79% and 90% depending on which desk you ask. The Fed, meanwhile, is holding at 3.50-3.75% but with three regional presidents dissenting in favour of a hike rather than a cut. That is an unusual configuration: two central banks both leaning hawkish, with the euro side having further to travel.
Why the differential still favours the euro
Compare real policy rates and the picture sharpens. The eurozone is running at roughly -0.65% in real terms against something closer to +0.25% in the United States. A 25bp ECB hike does not close that gap, but it compresses it — and compression is what currency markets pay for. That is the mechanism traders are leaning on when they talk about 1.1800 as a destination rather than a hope.
Positioning adds a second layer. Speculative accounts were stretched long dollars into late summer and have been unwinding that exposure through August. Part of the move to 1.1712 was that unwind rather than fresh euro conviction, which matters: a crowded trade that has already partly cleared has less fuel left in it than the price action suggests.
The levels that decide it
Overhead, the first real obstacle is 1.1685, the late-May high, with a Fibonacci retracement sitting almost on top of it at 1.1692. Clear that band and 1.1711/1.1712 — the 21 August high — becomes the test. Above there, the chart opens toward the early-May shelf at 1.1790-1.1800, which is where the rate-differential argument points.
Downside is where the discipline lives. The 1.1620-1.1622 area was resistance in mid-June and again on 17 August; converted supply of that kind usually gets defended on the first retest. Lose it and the 18-19 August lows near 1.1570 come in fast, with the 20-day EMA at 1.1577 reinforcing that shelf. A daily close below 1.1570 would tell you the August trend has broken rather than paused, and would put the 1.1500 base back in play.
One honest caveat on momentum: daily RSI readings are being quoted anywhere from the mid-40s to above 65 depending on the timeframe the source is using. That disagreement is itself information — it means the pair is stretched on the shorter horizon and neutral on the longer one, which is exactly what a consolidation inside an uptrend looks like.
The calendar is doing the pinning
Friday 28 August brings Kevin Warsh's first Jackson Hole keynote as Fed Chair. He has been explicit about wanting to reduce the market's dependence on forward guidance, which cuts both ways: less pre-positioning, but sharper reactions when he does speak. Core PCE landed at 3.3% year-on-year on 26 August, slightly hot but not a surprise, so Friday carries the full weight.
After that the sequence is 1 September JOLTS, 4 September payrolls, then the 10 September ECB decision. Note the asymmetry on that last one: with a hike this heavily priced, a delivered 25bp is close to a non-event, while a hold would be a genuine shock and would likely retrace the whole August advance.
How to frame the next two weeks
The workable read is a corrective pullback inside an intact near-term uptrend — buy weakness while 1.1620 holds, and stand aside if it does not. That is a level-based plan rather than a directional bet, which is the right posture when a single speech can reprice the dollar in an afternoon.
What separates a plan from a guess is knowing your invalidation before you enter. Traders who want the same structural read across the majors — key levels, scenario weights and event mapping updated as the calendar moves — can follow the Becoin.net Premium Forecast for the currency desk. If you are weighing how much coverage and signal frequency you actually need, the Becoin.net Tariff Plans page lays out what each tier includes.
For now, EUR/USD is a range with a bias. The bias is higher, the range is 1.1570-1.1712, and 1.1620 is the line that tells you which of those two facts still matters after Friday.

EUR/USD holds 1.1414 before the ECB decision: three scenarios
EUR/USD traded near 1.1414 before the ECB’s July decision. Here is what a hold, hawkish hold or surprise hike could mean for 1.1350 and 1.1480.

Simple Daily Trading Routine for Consistency
Most traders do not fail because of strategy alone. They fail because they are random. They trade when emotional, skip planning, increase risk after losses, and ignore review sessions. Consistency in trading usually comes from routine more than prediction. A simple daily trading routine helps you stay disciplined, reduce emotional mistakes, and improve decision making […]

Trading Currency Strength Instead of Single Pairs
It was a Tuesday afternoon when I realized I was fighting a losing battle against a ghost. My screen was a chaotic web of indicators. I had the EUR/USD chart open, a moving average crossing over here, a relative strength index flashing oversold there, and a price action setup that looked textbook perfect. I clicked […]

Which Broker Is Better for Weekend Trading?
It was a chilly Saturday morning, and while the rest of the world was sleeping in or catching up on shows, I was staring at a completely frozen screen. My usual EUR/USD chart looked like a heart monitor flatlining. The traditional markets were closed. The banks were shut down. For a long time, that was […]

IQ Option vs Deriv Chart Comparison
The Night I Realized My Charts Were Lying to Me It was three in the morning, the exact hour when the market looks either like a goldmine or a psychological hazard. I was sitting in front of two monitors, a lukewarm mug of coffee in hand, watching a critical support level on EUR/USD. On my […]

Deriv vs Binomo Deposit Methods: My 2026 Real Money Comparison Guide
I sat in the corner of a crowded coffee shop, my eyes fixed on my phone screen. After months of testing strategies on a demo account, I had finally saved up a small pocket of risk capital. I felt ready to trade live. A high-probability setup was forming on my charts, and my heart rate […]