Ethereum Price Analysis: Coiling Between 2400 and 2600
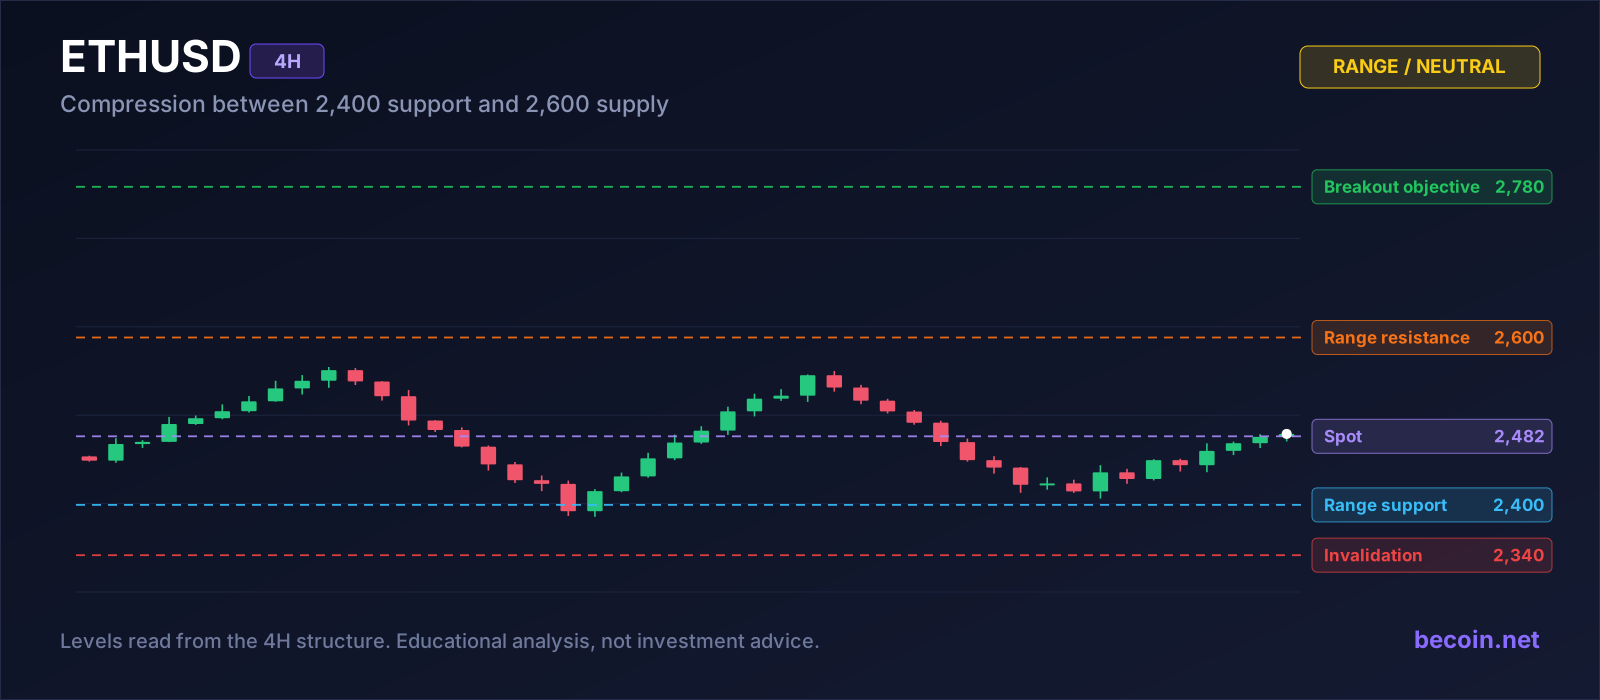
Ethereum has stopped trending and started compressing. Since the last impulsive leg the second-largest crypto has been carving out progressively smaller swings between roughly 2,400 and 2,600, with spot sitting near 2,482 in the middle of that band. Ranges like this are boring right up until they are not, and the compression itself is the signal worth paying attention to.
What this Ethereum price analysis is built on
The two edges of the range are not arbitrary. The 2,400 area is where buyers have stepped in three separate times, each time producing a fast reversal rather than a slow accumulation. The 2,560 to 2,600 band is where sellers have appeared just as reliably, capping every attempt to break higher within a few candles. Two levels defended repeatedly by opposite sides is the definition of a range, and it usually resolves with a decisive move rather than a drift.
What makes the current setup more interesting than a standard range is the narrowing. The distance between the swing highs and swing lows has been contracting for two weeks. Volatility that compresses tends to expand, and the direction of the expansion is what the whole trade is about.
The levels that matter
| Level | Price | Why it matters |
|---|---|---|
| Breakout objective | 2,780 | Measured move projected from the range height |
| Range resistance | 2,600 | Supply band that has capped four attempts |
| Spot reference | 2,482 | Mid-range, no edge in either direction |
| Range support | 2,400 | Defended three times with sharp reversals |
| Invalidation | 2,340 | Below the range floor; the compression resolved lower |
How to trade a coil without guessing
The mistake most traders make in a range this tight is picking a direction in advance. There is no reliable way to know which way a compression resolves, and the mid-range is the single worst place to take a position because both edges are equally close. The practical approach is to prepare two plans and let price choose.
The long plan triggers on a four-hour close above 2,600 with a stop back inside the range near 2,540 and an objective at 2,780. The short plan triggers on a close below 2,400 with a stop above 2,460 and a first objective in the 2,240 area where the last unfilled imbalance sits. Both are defined, both have sensible risk, and neither requires an opinion about which one will happen.
The trap to avoid
Compressed ranges produce more false breaks than clean ones. Price pokes through an edge, triggers the stops resting just beyond it, then reverses straight back inside. That is why the closing basis matters more than the touch. A wick through 2,600 that closes back at 2,570 is not a breakout, it is a liquidity sweep, and it frequently marks the top of the move rather than the start of one.
Waiting for a close costs a few points of entry and saves a great deal of frustration. If the move is real, there will be a retest of the broken edge, and that retest is usually the better entry anyway.
Putting the plan on the chart
Draw 2,400 and 2,600 as zones rather than lines, note where 2,780 and 2,240 sit as the two measured destinations, and decide now which candle close you will act on. Ranges reward preparation and punish improvisation more than any other structure.
For a modelled range projection to compare with your own, the Becoin.net Premium Forecast tracks crypto levels alongside the simulator, and the access tiers are listed on the Becoin.net Tariff Plans page.

Best Broker for Learning Price Action in 2026 (Tested by Real Traders)
Most traders think they need a better strategy. What they actually need is a better understanding of price. A few years ago, one of our community members had over ten indicators on his chart. RSI. MACD. Moving averages. Bollinger Bands. Stochastic. Every new YouTube video added another indicator. The result? More confusion. Not more profits. […]

Why Traders Move from Binomo to Deriv in 2026: The Real Reasons Behind the Switch
If you spend enough time around trading communities, you’ll notice a pattern. Many traders start with Binomo. Then, after a few months, a surprising number begin looking at Deriv. Some switch completely. Others keep both accounts but gradually move most of their trading activity to Deriv. I noticed this trend while talking to beginner traders […]

Deriv vs IQ Option for Synthetic Indices: Which Platform Is Better in 2026?
Synthetic indices have become one of the most talked about trading categories among beginners and experienced traders alike. Unlike forex or crypto markets that depend on real world events, synthetic indices operate 24/7 using algorithm driven price movements. That means traders can access opportunities at any time without waiting for market openings or major news […]
Binomo Minimum Deposit vs Minimum Withdrawal: The Real Trap Beginners Miss
I almost fell for the simplest trap on Binomo. Not a bad entry.Not a losing strategy.Not even a bad signal. It was the gap between the Binomo minimum deposit vs minimum withdrawal that quietly changes how beginners behave. When I first opened a real account, the low entry point looked harmless. That’s exactly why it […]
Why Most Deriv Traders Blow Accounts: A Data-Driven Post-Mortem Analysis
The first time I blew a trading account on Deriv, it didn’t happen dramatically. There was no single catastrophic trade. It happened quietly. One loss turned into another. Then I increased the stake to recover the loss. Then the market moved again. Before I realized what had happened, an account balance that took weeks to […]
Deriv Copy Trading (DBot & Signal Services): Can Automation Beat Manual Trading?
When I first started trading on Deriv, everything I did was manual. Every entry, every exit, every mistake. I would sit in front of charts watching price ticks move on synthetic indices, trying to time trades perfectly. Some days I would catch a streak of wins and feel like I had finally figured it out. […]