
Dogecoin Forecast: DOGE at 0.0820 Breaks a Three-Week Range
- Dogecoin trades at 0.0820, up 1.94% on the day and holding most of a vertical break that reached 0.0824.
- Spot Dogecoin ETFs recorded their first monthly outflows in July 2026, with net assets of roughly $9.96 million against about $12 million raised since launch.
- The 0.0756 fast moving average is the level that decides the next move; it is the first support the breakout has left behind.
Fundamental Analysis: Dogecoin
The institutional channel is not driving this. Spot Dogecoin ETFs launched in November 2025 and had attracted roughly $12 million in cumulative inflows before July 2026 delivered their first outflow month, a modest $525,980 withdrawal that nonetheless broke the pattern. Total net assets of about $9.96 million make the vehicle a rounding error next to the token's market capitalisation, which tells you where the marginal buyer is not coming from.
The counterweight is that the wider digital-asset complex has been absorbing money. Weekly spot inflows across the largest ETF products topped $1.3 billion earlier in August, spread across the majors. Risk appetite in the asset class is present; it is simply being routed through products that exist at scale rather than through Dogecoin's own listed wrapper.
The balance means this advance should be read as a retail and derivatives-led repricing, not an institutional accumulation. Moves of that character tend to be fast, to overshoot, and to retrace a significant portion of the distance once leveraged positioning is cleared. That does not make the breakout false — it makes the level it retraces to more informative than the high it prints.
Technical Analysis: Dogecoin
For most of August the token did nothing at all, oscillating between roughly 0.0690 and 0.0720 in a range so tight the moving averages flattened into a single line. That changed on 19 August, when price broke vertically and ran to 0.0824 in under two sessions, leaving a gap between the current price and every average beneath it — 0.0756, 0.0728, 0.0720 and 0.0717.
Resistance is the 0.0824 session high, with little structure above it until the 0.0840 area. Support is the 0.0800 round number, then the 0.0756 fast average, which is where a normal post-breakout retracement would be expected to hold. A four-hour close back beneath 0.0720 would return price to the old range and mark the break as a failure.

Which Broker Has Faster Withdrawals? Real 2026 Comparison for Traders
When most beginners choose a broker, they focus on bonuses, signals, or flashy interfaces. But after trading for a while, you realize one thing matters more than almost anything else: How fast can you actually withdraw your money? A broker can look perfect until your first withdrawal request gets stuck in “processing” for three days. […]

Deriv vs Binomo for Low-Risk Trading in 2026: Which Platform Is Better for Safer Growth?
Most beginners enter trading with one simple goal: avoid blowing up their account in the first week. That is exactly why low-risk trading matters more than fast profits. Two platforms that constantly appear in beginner discussions are Deriv and Binomo. Both allow small deposits, short-term trading, and beginner-friendly access. But when your focus is protecting […]

Simple Daily Trading Routine for Consistency
Most traders do not fail because of strategy alone. They fail because they are random. They trade when emotional, skip planning, increase risk after losses, and ignore review sessions. Consistency in trading usually comes from routine more than prediction. A simple daily trading routine helps you stay disciplined, reduce emotional mistakes, and improve decision making […]
Risk Management for Small Accounts ($10–$50)
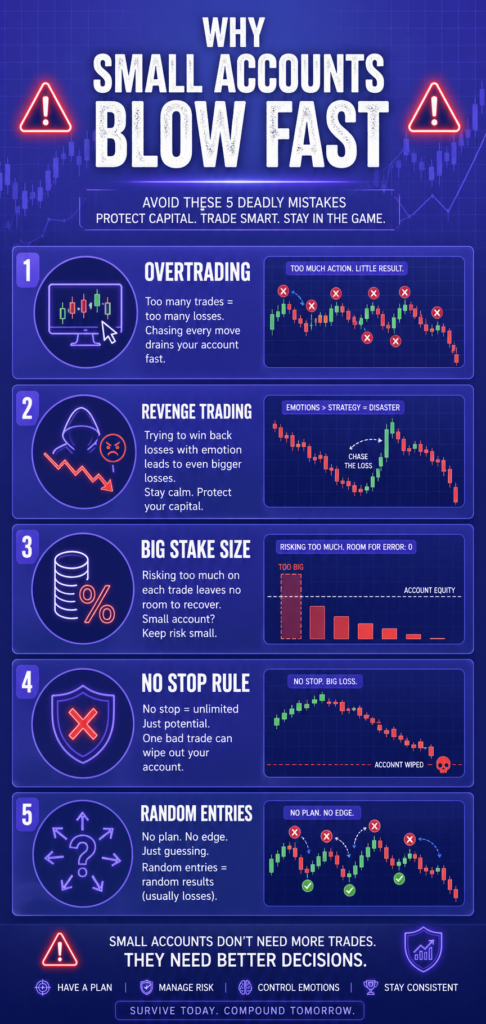
Starting with a small trading account can feel frustrating. You want fast growth, but one bad decision can wipe out weeks of progress. That is why risk management matters more for a $10 account than for a $1,000 account. Many beginners focus only on strategy. They search for the best indicators, signals, or entry methods. […]

Fastest Withdrawal Brokers (Real Test Results)
The first time I made a profitable trade, I wasn’t thinking about strategy anymore. I was thinking about one thing. Can I actually withdraw this? I requested my payout and waited. And waited. That “processing” label stayed there longer than my trade itself. That moment changed how I evaluate brokers. Since then, I’ve made it […]

Best Broker for $10 Deposit (Tested Platforms – 2026)
If you are starting with a $10 deposit, choosing the wrong broker will cost you more than the market itself. Most platforms look similar, but execution speed, withdrawal behavior, and usability are very different in practice. This page is designed to help you make a fast, clear decision. No unnecessary details. Only tested platforms that […]