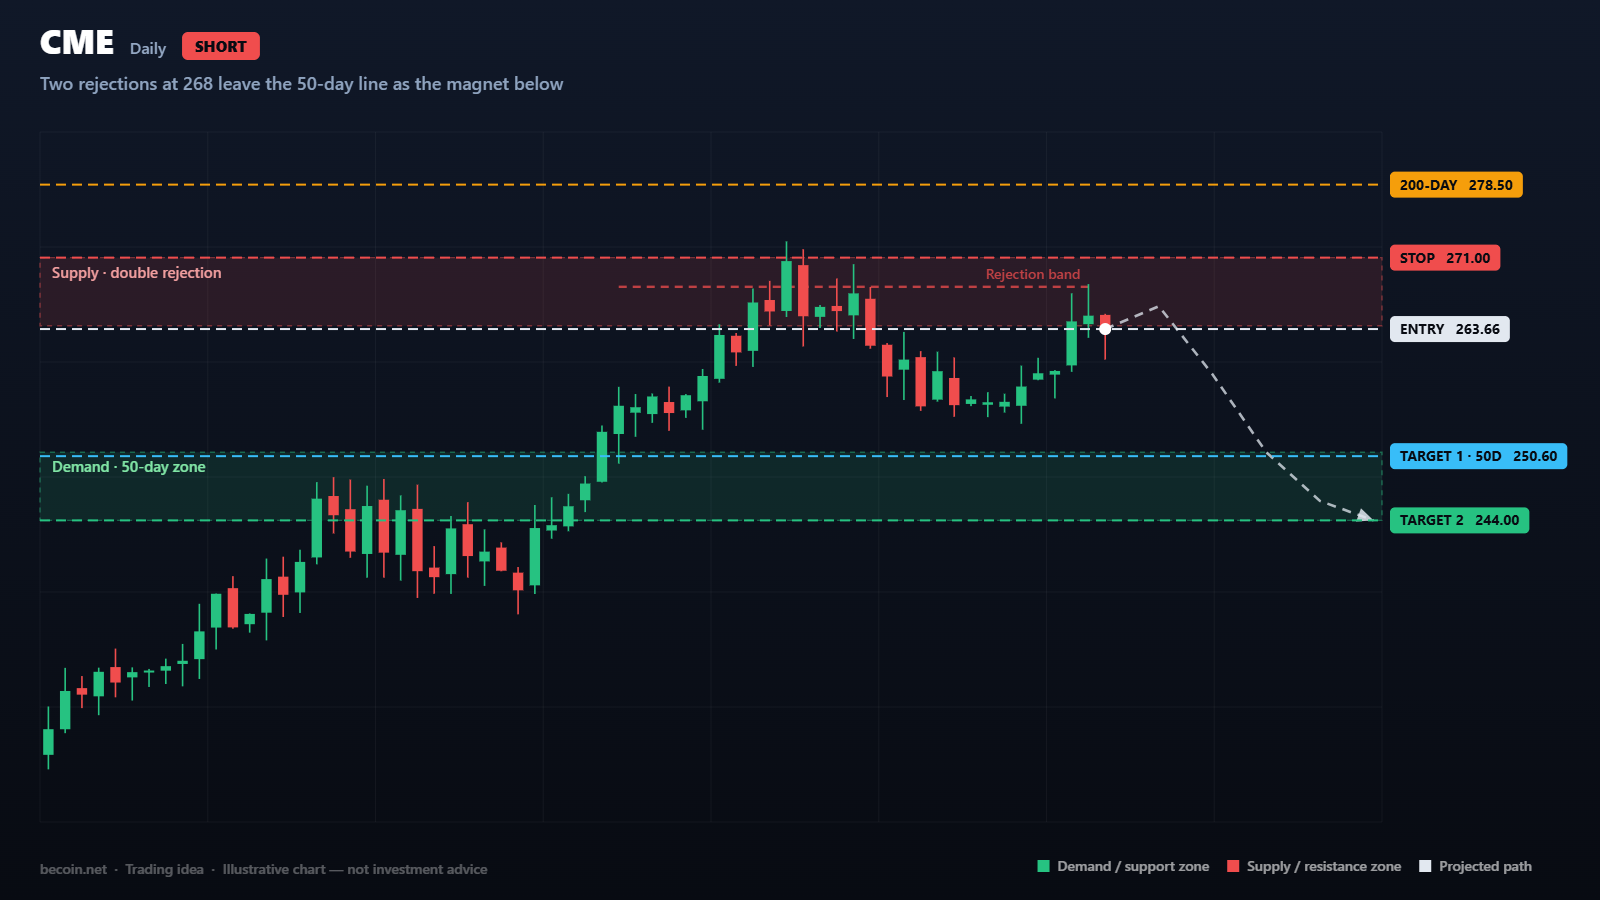
CME Group Rejected Twice at 268 as 244 Comes Into View
Where the stock stands
CME Group is trading around 263.66, roughly midway between its 52-week low at 218.31 and its high at 329.16. The recovery from the lows has been genuine, and the stock now sits comfortably above its 50-day average at 250.60. The problem is what happens above: the 200-day average at 278.50 is still overhead and still sloping down, which keeps the medium-term trend pointing lower even while the short-term one points higher.
Momentum has pushed up to a daily RSI near 60. That is firm but not extreme, and in a stock trading below its 200-day average it usually signals the upper end of a counter-trend bounce rather than the start of something larger.
What the chart is showing
The detail that matters is the behaviour at 268. Price has reached that area twice in recent weeks and been turned away both times, leaving upper wicks on the daily candles rather than closes above it. A single rejection is information. A second rejection at the same price is a pattern, and it tells you sellers have a resting interest there that buyers have not been able to absorb.
Beneath the market, the 244 to 251 band contains both the 50-day average and the consolidation the stock built before the last push higher. That is the natural place for price to gravitate if the 268 ceiling holds.
Levels that matter
Resistance is 264 to 271, with 271 as the specific level that would negate the double-rejection read. Above that, 278.50 at the 200-day is the level that would flip the medium-term picture.
Support is 250.60 first, then 244. Below 244 there is limited structure until the 232 area, so a break there would likely be quick rather than orderly.
How the idea could play out
The idea is a rotation back to the lower end of the range. Selling near 263 to 266 with a stop above 271 gives about seven dollars of risk against a first objective of 250.60 and a second at 244. That is roughly 1.8 times risk on the first target and 2.7 times on the second, which is a reasonable profile for a range trade.
The key discipline is treating 271 as a hard line. The entire premise is that 268 holds; if it does not, there is no thesis left to defend and no reason to widen the stop.
What would invalidate it
A daily close above 271 breaks the rejection pattern. A close above 278.50 would put the 200-day average behind the stock and shift the medium-term trend from down to sideways or better. Either outcome means the short idea is finished, and the more interesting question at that point becomes whether the stock is worth owning rather than fading.
Managing the position
Exchange operators tend to benefit from volatility in the markets they serve, which creates an unusual dynamic: a broad market selloff that hurts most equities can actually support trading volumes here. That makes CME a poor instrument for expressing a general bearish view and a better one for expressing a specific technical one. Keep the trade tied to the 268 level rather than to a macro opinion.
Covering half at the 50-day average and moving the remaining stop to break-even is the simplest way to protect a range trade that has already worked.
The bottom line
Two rejections at the same price, a declining 200-day average overhead, and clear support 15 to 20 dollars below add up to a defined, unglamorous setup. The reward is modest and the invalidation is close, which is exactly what a range trade should look like.
Becoin.net Premium Forecast - Becoin.net Tariff Plan
This analysis is a technical study prepared for educational purposes. It is not investment advice, and no outcome described here is guaranteed. Trade only with capital you can afford to lose.

Bitcoin slips to $65,741 as oil and yields test the breakout
Bitcoin is near $65,741 as rising oil and Treasury yields test the $65.7K breakout floor. Here are the levels that confirm or invalidate the move.

Trading Currency Strength Instead of Single Pairs
It was a Tuesday afternoon when I realized I was fighting a losing battle against a ghost. My screen was a chaotic web of indicators. I had the EUR/USD chart open, a moving average crossing over here, a relative strength index flashing oversold there, and a price action setup that looked textbook perfect. I clicked […]

The Day I Stopped Trading and Finally Started Making Money
It was a rainy Tuesday morning, and I was staring at my screen with a familiar knot in my stomach. The previous three days had been a slow, agonizing slide into the red. I had given back two weeks of hard-earned profits in less than seventy-two hours. Every asset I clicked on looked like a […]

The Rookie Dashboard: My Raw Hunt for the Best Beginner Broker in 2026
We have all been there. It is late at night, your morning coffee is hours away, and you are staring at a screen pulsing with bright green and red lines. You have twenty dollars burning a hole in your digital wallet and a sudden, burning desire to conquer the financial markets. That was me exactly […]

Chasing Safety in a High-Stakes World: My Quest for the Best Low-Risk Trading Platforms
I still remember the sinking feeling in my stomach when I lost my first tiny trading account. It wasn’t a massive fortune, but it was mine. That night, I realized a brutal truth about this industry: most beginners fail not because they lack passion, but because they dive into high-risk environments without a life jacket. […]

The Best Broker Without Complicated Features (And Why Simplicity Wins)
Most traders don’t fail because they lack knowledge. They fail because their platform buries them in noise before they even place their first trade. Here’s what actually works. It Started With a Confession From a $10 Trader A reader messaged us a few months back. He had been trying to trade for three weeks, had […]