CHF/JPY Drops 3% in a Week — Why 195.60 Decides If the Dip Gets Bought
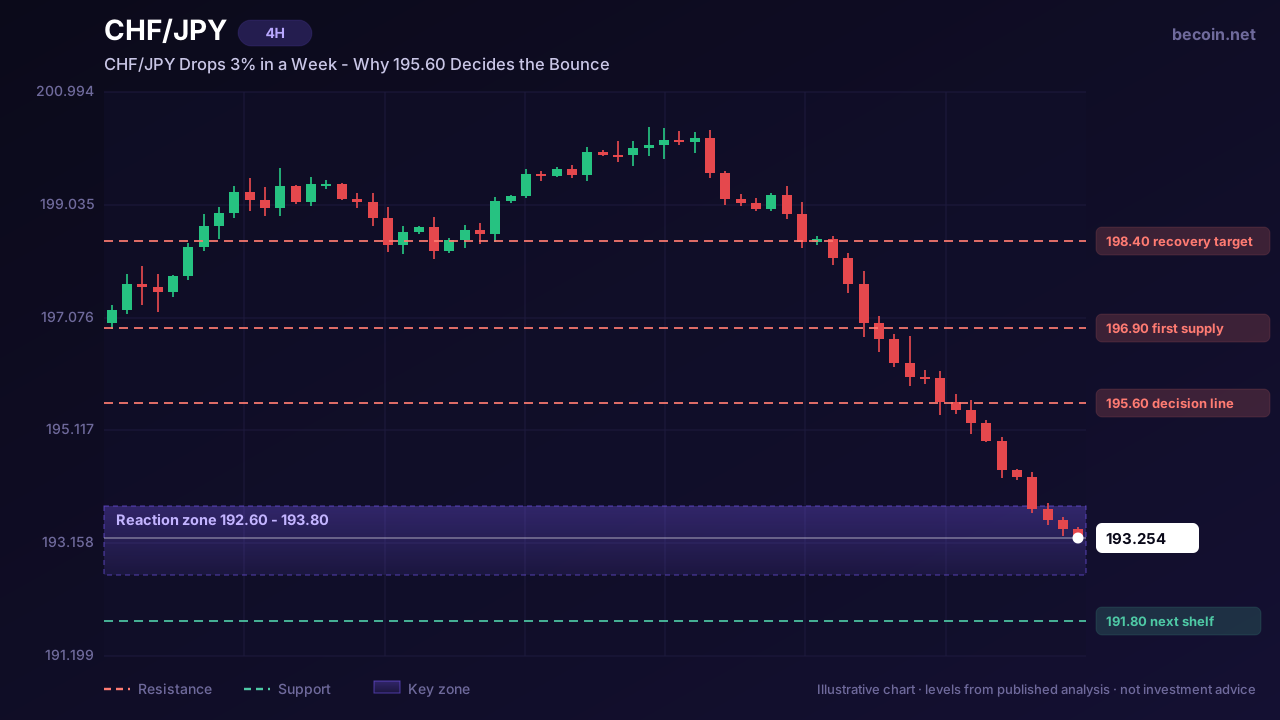
CHF/JPY is at 193.25, down 0.6% on the day and roughly 3.3% over the past week. For a cross that spent most of the year making slow, orderly highs, that is a genuine change of character — and it has put two very different groups of traders on the same level.
A quiet trend that stopped being quiet
The franc-yen cross had been one of the more reliable carry expressions available. A low-yielding funding currency on one side, a chronically weak yen on the other, and a policy backdrop that gave neither central bank an obvious reason to disturb the arrangement. Price drifted up, pullbacks were shallow, and the trend asked very little of anyone holding it.
That arrangement is now under review. The move down has been steeper and more continuous than anything in the prior advance, and it came from a level that had already produced multiple rejections. When a slow uptrend gives back a month of progress in five sessions, the first assumption should be that positioning is being cleared, not that a new downtrend has been established.
Why the selloff looks mechanical
The shape of the decline matters. It has been persistent rather than punctuated — long-bodied candles, limited retracement, few pauses. That profile usually points to forced flow rather than fresh conviction: stops triggering, carry positions being reduced, risk desks trimming exposure into a volatility uptick. It is the kind of move that overshoots. Our Becoin.net Premium Forecast tracks this pair through each of those levels session by session.
The counter-argument is equally simple. Overextended does not mean over. Markets that unwind crowded trades routinely go further than the technicals justify, precisely because the people who would normally step in are the ones being liquidated.
The first CHF/JPY level that means anything
Around 195.60 is where the rebound argument has to start. It sits just above the current shelf and marks the base of the breakdown, which makes it the natural first supply on any recovery attempt. Reclaiming it on a four-hour closing basis would say the flush is done and the market is rebuilding. Failing there — a push into it that gets sold — would confirm the market is now selling rallies rather than buying dips, which is a meaningful regime change for this pair.
If 195.60 goes, the next reference points are 196.90 and then the 198.40 area, where the decline began accelerating. That would be a normal retracement of an overdone move, not a resumption of the uptrend, and traders should be honest with themselves about the difference.
The bearish case has a shape too
Not everyone reads this as a dip. The higher-timeframe argument is that price completed a topping structure near the highs after multiple failed attempts to extend, and that the current decline is the first leg of something larger. That view points well below current levels, with the caveat that it requires the 193 area to break decisively rather than chop.
Both cases can be tested against the same chart. Hold above the current shelf and reclaim 195.60, and the rebound crowd has the evidence. Lose the shelf on a closing basis and the next real support is not until around 191.80, and the topping argument gets a lot more credible.
Reading the next few sessions
The most useful thing to watch is not the direction of the next move but its quality. A recovery that reclaims 195.60 on shrinking range and thin follow-through is a bounce to sell. A recovery that reclaims it with expanding range and holds the level on a retest is the start of a repair. The number is the same in both cases — what it means depends entirely on how price gets there.
Access levels for the daily level maps, scenario updates and alerts are set out on Becoin.net Tariff Plans.
This is market analysis for educational purposes and is not investment advice. Trading carries risk of loss.

Which Broker Has Faster Withdrawals? Real 2026 Comparison for Traders
When most beginners choose a broker, they focus on bonuses, signals, or flashy interfaces. But after trading for a while, you realize one thing matters more than almost anything else: How fast can you actually withdraw your money? A broker can look perfect until your first withdrawal request gets stuck in “processing” for three days. […]

Deriv vs Binomo for Low-Risk Trading in 2026: Which Platform Is Better for Safer Growth?
Most beginners enter trading with one simple goal: avoid blowing up their account in the first week. That is exactly why low-risk trading matters more than fast profits. Two platforms that constantly appear in beginner discussions are Deriv and Binomo. Both allow small deposits, short-term trading, and beginner-friendly access. But when your focus is protecting […]

Capital Core Account Types Explained: Which One Fits Your Trading Budget?
When I first started looking at Capital Core account types, I made the same mistake most traders make. I looked at the bonus first. Then I looked at the leverage. And only after that did I start asking the question that actually matters: Which account can I realistically manage without forcing trades just because I […]

The Day I Stopped Trading and Finally Started Making Money
It was a rainy Tuesday morning, and I was staring at my screen with a familiar knot in my stomach. The previous three days had been a slow, agonizing slide into the red. I had given back two weeks of hard-earned profits in less than seventy-two hours. Every asset I clicked on looked like a […]

Which Broker Has Better Risk Management Tools?
The burning smell of my own account blowing up is a scent I will never forget. It was a rainy Tuesday afternoon a few years back. I sat huddled over my laptop, watching a currency pair oscillate. Confident, arrogant, and entirely unprotected, I clicked buy. Minutes later, a sudden market spike completely wiped out my […]

IQ Option vs Deriv Chart Comparison
The Night I Realized My Charts Were Lying to Me It was three in the morning, the exact hour when the market looks either like a goldmine or a psychological hazard. I was sitting in front of two monitors, a lukewarm mug of coffee in hand, watching a critical support level on EUR/USD. On my […]