CAC 40 Idles Below Its 8,755 Record With 8,540 as the Line
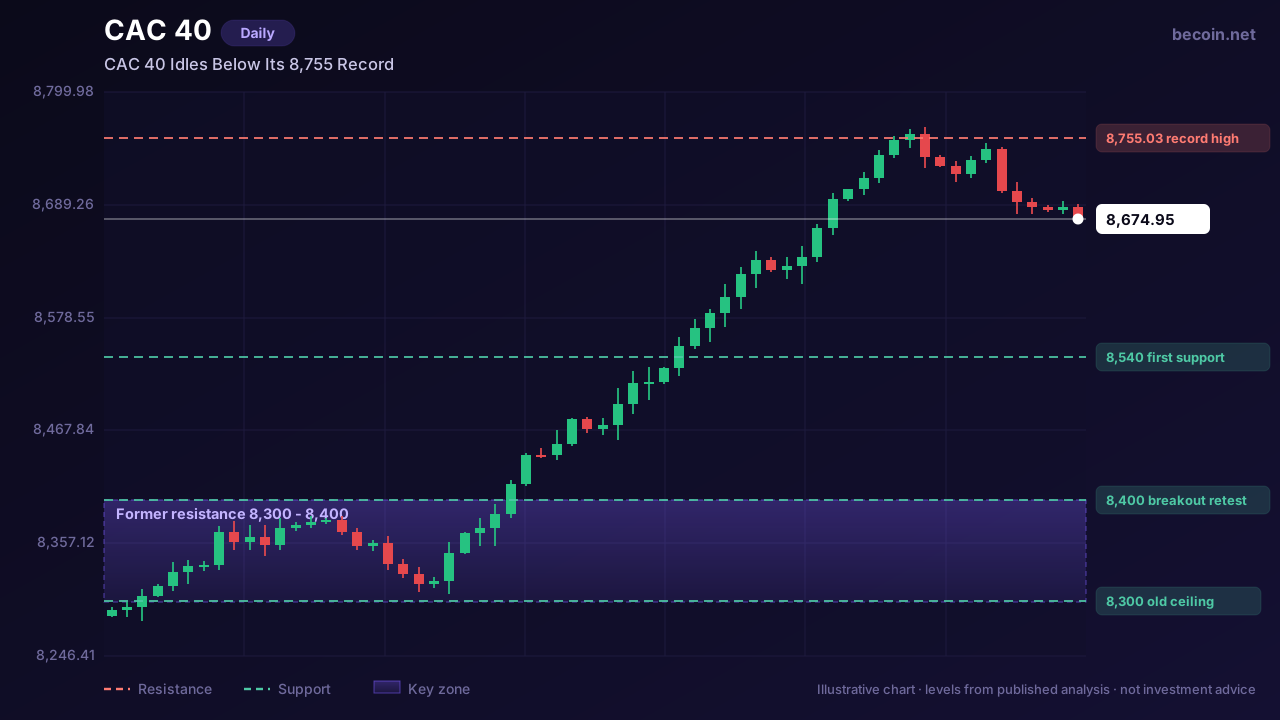
The CAC 40 sits at 8,674.95, down a fraction on the day, up a quarter of a percent on the week, nearly 5% on the month and 12% over the past year. It reached an all-time high of 8,755.03 on 7 August and has spent the sessions since drifting sideways just underneath it.
What the rally already cleared
The interesting part of this chart is not the record — it is what happened before it. For a long stretch, 8,300 to 8,400 was the ceiling that repeatedly turned the index back. Traders were writing about that band as major resistance well into the summer, with breakout targets in the 8,500 to 8,700 range.
Those targets have been hit. The band that capped the index is now well below price, which means the structure has genuinely changed rather than merely extended. When an index clears a level that held for months and then holds above it, the burden of proof shifts to the sellers.
The CAC 40 line that separates pause from top
Around 8,540 is the first level that matters on the way down. It marks the shelf the index built during the final push to the record and is where a normal consolidation should find support. Holding it keeps this a pause. Our Becoin.net Premium Forecast follows this index through each of those levels session by session.
Below that, the 8,400 area is the more consequential test, because that is the top of the former resistance band. An index that breaks out, drifts, and then falls back into the range it just escaped is usually telling you the breakout was liquidity rather than demand. That is the sequence to watch for, and it is the one that distinguishes a healthy consolidation from a failed one.
Why the composition matters here
The CAC is not a broad economic proxy in the way its name suggests. It is heavily weighted toward luxury goods, industrials, energy and banks, which means it responds to global demand, the euro, and the rate cycle more than to French domestic activity. Luxury in particular has an outsized influence, and that sector's fortunes are tied closely to Chinese consumer demand.
This matters for the chart because it explains why the index can drift near a record while the domestic backdrop looks unremarkable. It also identifies the risk: a concentrated index is a concentrated bet, and the same weighting that drove the advance can reverse it quickly if one sector re-rates.
Reading the drift
Sideways action beneath a record is genuinely ambiguous, and traders should resist the urge to resolve the ambiguity in advance. Two readings fit the current price action equally well. In the first, the index is absorbing supply from the breakout, holding its gains, and preparing to extend — the higher lows into the record support that view. In the second, momentum has quietly faded, each attempt at the high is coming with less force, and the index is distributing into strength.
The tiebreaker is behavioural rather than analytical. Watch how price reacts to the first genuine pullback. If 8,540 holds and the index recovers with expanding range, the consolidation resolves higher and the record falls. If the pullback runs through 8,540 without a meaningful bounce and starts probing 8,400, the more cautious analysts calling for a short-term reversal from all-time-high territory will have made their case.
Records are not resistance in any technical sense — there is no overhead supply above an all-time high, which is precisely why breakouts to new records often run further than expected. But they are psychological events, and indices frequently need more than one attempt to get through the round-number pull of a level like this. The CAC has come to 8,755 once. What it does on the second approach will say considerably more.
Access levels for the daily level maps, scenario updates and alerts are set out on Becoin.net Tariff Plans.
This is market analysis for educational purposes and is not investment advice. Trading carries risk of loss.

Deriv vs IQ Option for Synthetic Indices: Which Platform Is Better in 2026?
Synthetic indices have become one of the most talked about trading categories among beginners and experienced traders alike. Unlike forex or crypto markets that depend on real world events, synthetic indices operate 24/7 using algorithm driven price movements. That means traders can access opportunities at any time without waiting for market openings or major news […]

Finding My Perfect Workspace: The Search for the Best Broker for My Daily Trading Routine
The alarm goes off at 6:00 AM. By 6:30 AM, I am sitting in front of my monitors with a steaming mug of black coffee. The house is completely quiet, the market is preparing its next major move, and my charts are completely bare. This is my daily sanctuary. For a long time, this morning […]

IQ Option vs Deriv Chart Comparison
The Night I Realized My Charts Were Lying to Me It was three in the morning, the exact hour when the market looks either like a goldmine or a psychological hazard. I was sitting in front of two monitors, a lukewarm mug of coffee in hand, watching a critical support level on EUR/USD. On my […]

Which Broker Has Faster Withdrawals? Real 2026 Comparison for Traders
When most beginners choose a broker, they focus on bonuses, signals, or flashy interfaces. But after trading for a while, you realize one thing matters more than almost anything else: How fast can you actually withdraw your money? A broker can look perfect until your first withdrawal request gets stuck in “processing” for three days. […]

Which Broker Is Better for Students in 2026?
For students, trading usually starts with one simple goal: learning how markets work without risking too much money. Most students are not starting with huge budgets. They are trading from a phone, using mobile internet, balancing studies, and trying to avoid losing money quickly. That changes what actually matters in a broker. The “best broker” […]

Deriv vs Binomo for Low-Risk Trading in 2026: Which Platform Is Better for Safer Growth?
Most beginners enter trading with one simple goal: avoid blowing up their account in the first week. That is exactly why low-risk trading matters more than fast profits. Two platforms that constantly appear in beginner discussions are Deriv and Binomo. Both allow small deposits, short-term trading, and beginner-friendly access. But when your focus is protecting […]