BNB Forecast: The $600 Floor Decides Whether $650 Stays Realistic
Quiet Weakness Is Still Weakness
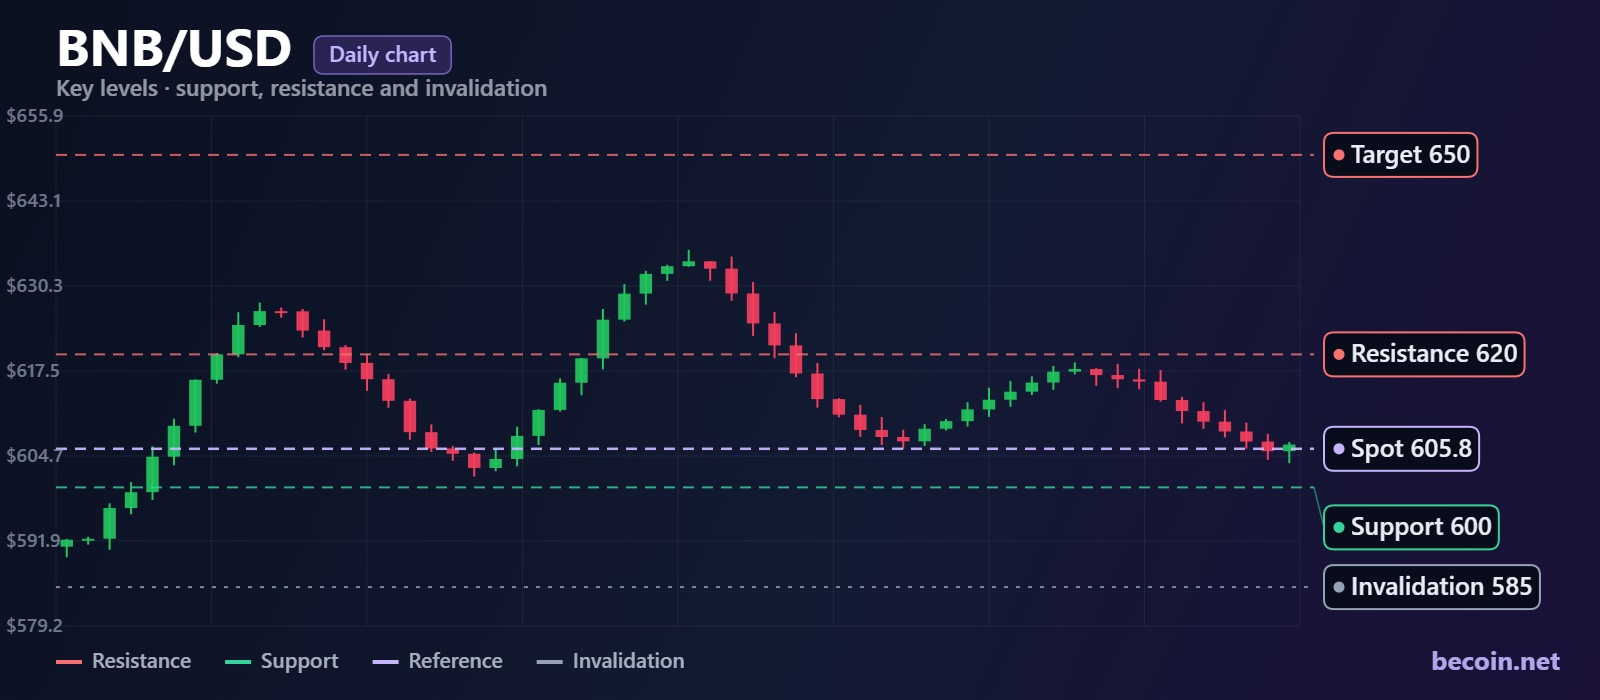
BNB around 605.81 has been sliding by fractions rather than falling. Daily declines have stayed under one percent, the intraday range has compressed to roughly 605 to 612, and volume has thinned out alongside it. That combination usually resolves rather than continues, and the resolution tends to be sharper than the drift that preceded it.
The setup is worth mapping now precisely because it is boring. Ranges this tight rarely last, and the levels that matter are unusually easy to identify while the market is quiet.
Why the BNB Forecast Starts at the 600 Floor
The round number at 600 has been the operative floor for weeks. Price has dipped into the high 590s intraday and been pulled back above 600 by the close every single time, which is the behaviour of a defended level rather than a coincidence.
What makes it credible is what sits beneath it. Between 600 and roughly 585 there is very little historical trading activity, so a sustained loss of the floor would not find natural buyers straight away. That is the risk anyone tracking these levels has to price in: the fall from the floor is likely to be quicker than the grind toward it.
620 Is the First Real Ceiling
Every bounce over the last stretch has stalled between 618 and 622. That is the supply pocket left behind by the last leg down, and it has been rejected cleanly enough that it now functions as the first genuine test for buyers.
Clearing it matters more than it looks. Above 620 the chart has a lot less overhead resistance until roughly 650, which is why the 650 target keeps appearing in analysis across the market. The target is not unreasonable; it is simply conditional on a level that has not been taken yet.
The Fundamental Tension Underneath
BNB carries a different kind of support than most large-cap tokens because its demand is tied to actual exchange and chain usage rather than pure speculation. Transaction activity has stayed resilient, and the supply reduction schedule continues to remove tokens on a predictable cadence. That is the argument for the 600 floor holding.
The counterweight is that BNB rarely fights the broader crypto tape for long. With Bitcoin stuck in its own range and Ethereum pinned below key resistance, there is little rotational capital available to force a breakout. BNB is more likely to follow the market out of consolidation than to lead it.
A Practical Way to Frame the Setup
The cleanest structure here is patience with defined edges. A confirmed daily defence of 600 gives longs a tight invalidation just below 585, with 620 as the first objective and 650 as the extension if the ceiling breaks. A rejection at 620 gives shorts a defined risk above 625 and a first target back at the floor.
Trading the middle of a 20-point band is where accounts get worn down. If you would rather have the zones updated as they shift instead of redrawing them every session, the running scenarios in Becoin.net Premium Forecast cover BNB alongside the other majors with the same level-by-level structure. What each access tier includes is set out on Becoin.net Tariff Plans.
What Would Break This Idea
A daily close below 585 invalidates the constructive case entirely. It would confirm the 600 defence as distribution and open a stretch of chart with almost no support until considerably lower, and it would take the 650 target off the table for the foreseeable future.
The bullish invalidation is simpler. A daily close above 622 that holds into the following session ends the range, turns 620 into support, and makes 650 the working objective rather than the aspiration. Until one of those closes prints, BNB is a level-to-level market and should be traded as one.

Deriv vs IQ Option for Beginners in 2026: Which Platform Is Better to Start With?
Choosing your first trading platform can decide whether you stay consistent or quit after blowing your first account. Most beginners do not fail because trading is impossible. They fail because they start on platforms that confuse them, encourage emotional trading, or make risk management difficult. Two names that often appear in beginner discussions are Deriv […]

Capital Core Account Types Explained: Which One Fits Your Trading Budget?
When I first started looking at Capital Core account types, I made the same mistake most traders make. I looked at the bonus first. Then I looked at the leverage. And only after that did I start asking the question that actually matters: Which account can I realistically manage without forcing trades just because I […]

Deriv Volatility 75 Strategy Backtest: What Actually Works After 1,000 Trades?
The first time I tried trading Volatility 75, I thought I had found the perfect market. No news shocks. No central banks. Just clean, continuous price movement. Within two weeks, I blew my first account. That experience forced me to stop guessing and start testing. Instead of chasing indicators or copying strategies from forums, I […]

WTI reaches $89.43 as Brent clears $95 on renewed supply risk
WTI traded near $89.43 while Brent moved above $95 as Middle East shipping risk lifted crude for a fifth session. Key levels, catalysts and invalidation.

Alphabet falls to $329.71 premarket as AI spending eclipses cloud growth
Alphabet traded near $329.71 premarket after strong Q2 revenue and cloud growth collided with a much larger AI spending plan. What investors need to watch.

Bitcoin slips to $65,741 as oil and yields test the breakout
Bitcoin is near $65,741 as rising oil and Treasury yields test the $65.7K breakout floor. Here are the levels that confirm or invalidate the move.