
AMZN Stock Forecast: Amazon Defends 259 After AWS Surge
- AMZN trades at 259.45, down 0.71% overnight and about 10% below the 288 high reached in early August.
- AWS revenue grew 37% to $42.2 billion, its fastest rate in 18 quarters, on a $169 billion annualised run rate.
- Price is sitting directly on the 259.11 moving average; losing it opens 254.20 and the post-earnings gap.
Fundamental Analysis: AMZN
The second quarter was the strongest AWS print in four years. Segment revenue of $42.2 billion grew 37%, the fastest in eighteen quarters, taking the annualised run rate to $169 billion. Group net sales reached $200.6 billion, up 20%, and operating income rose 43% to $27.5 billion. Management also flagged triple-digit growth in both the AI and custom-chip businesses, each now past a $25 billion annual run rate.
The guidance is where the enthusiasm meets resistance. Third-quarter net sales are guided to $197.0–202.0 billion, implying 9–12% growth against the 20% just delivered, and operating income is guided to $22.5–26.5 billion — a range whose midpoint sits below the quarter just reported. Reported EPS of $5.75 against $1.68 is also inflated by $53.4 billion of non-operating investment gains rather than trading performance.
So the market is holding two facts at once: the cloud franchise is accelerating, and the company is telling investors the next quarter will be slower and less profitable. That is a recipe for a stock that gaps higher on the result and then drifts, which is precisely the pattern since 30 July.
Technical Analysis: AMZN
The move that defines this chart is the 30 July earnings gap, which lifted price from roughly 232 to the 270 area in a single session and then extended to 288 in early August. The retracement has been steady rather than sharp, and the latest four-hour bar closed at 259.52 with overnight trade at 259.92. The 259.11 moving average is directly beneath spot, with 254.20 and 248.29 rising underneath it and 264.24 rolling over above.
Resistance is 264.24 first, then the 270 shelf where the gap originally stalled, and 288 beyond that. Support is 259.11, then 254.20 and 248.29. A four-hour close below 248.29 would break the entire rising average structure and put the unfilled portion of the July gap back in play, which is the level that invalidates the bullish case.

Which Broker Has Faster Withdrawals? Real 2026 Comparison for Traders
When most beginners choose a broker, they focus on bonuses, signals, or flashy interfaces. But after trading for a while, you realize one thing matters more than almost anything else: How fast can you actually withdraw your money? A broker can look perfect until your first withdrawal request gets stuck in “processing” for three days. […]

Alphabet falls to $329.71 premarket as AI spending eclipses cloud growth
Alphabet traded near $329.71 premarket after strong Q2 revenue and cloud growth collided with a much larger AI spending plan. What investors need to watch.

Trading Currency Strength Instead of Single Pairs
It was a Tuesday afternoon when I realized I was fighting a losing battle against a ghost. My screen was a chaotic web of indicators. I had the EUR/USD chart open, a moving average crossing over here, a relative strength index flashing oversold there, and a price action setup that looked textbook perfect. I clicked […]

Which Broker Has the Cleanest Interface? Real Comparison for Beginners in 2026
Looking for the cleanest trading interface in 2026? Compare Binomo, IQ Option, Quotex, Deriv, and more based on speed, layout, usability, mobile experience, and beginner friendliness. When most beginners choose a broker, they focus on bonuses, payouts, or deposit methods. But after testing multiple platforms for months, I realized something surprising: A messy interface can […]

Deriv vs Binomo for Low-Risk Trading in 2026: Which Platform Is Better for Safer Growth?
Most beginners enter trading with one simple goal: avoid blowing up their account in the first week. That is exactly why low-risk trading matters more than fast profits. Two platforms that constantly appear in beginner discussions are Deriv and Binomo. Both allow small deposits, short-term trading, and beginner-friendly access. But when your focus is protecting […]
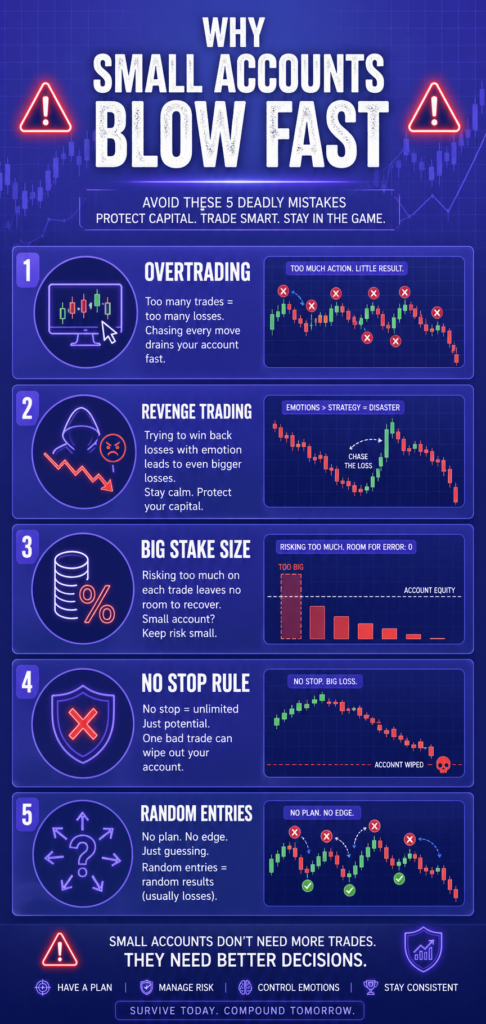
Risk Management for Small Accounts ($10–$50)
Starting with a small trading account can feel frustrating. You want fast growth, but one bad decision can wipe out weeks of progress. That is why risk management matters more for a $10 account than for a $1,000 account. Many beginners focus only on strategy. They search for the best indicators, signals, or entry methods. […]