AMD Stock Forecast: 469.46 Rebuilds Under the 483 Average
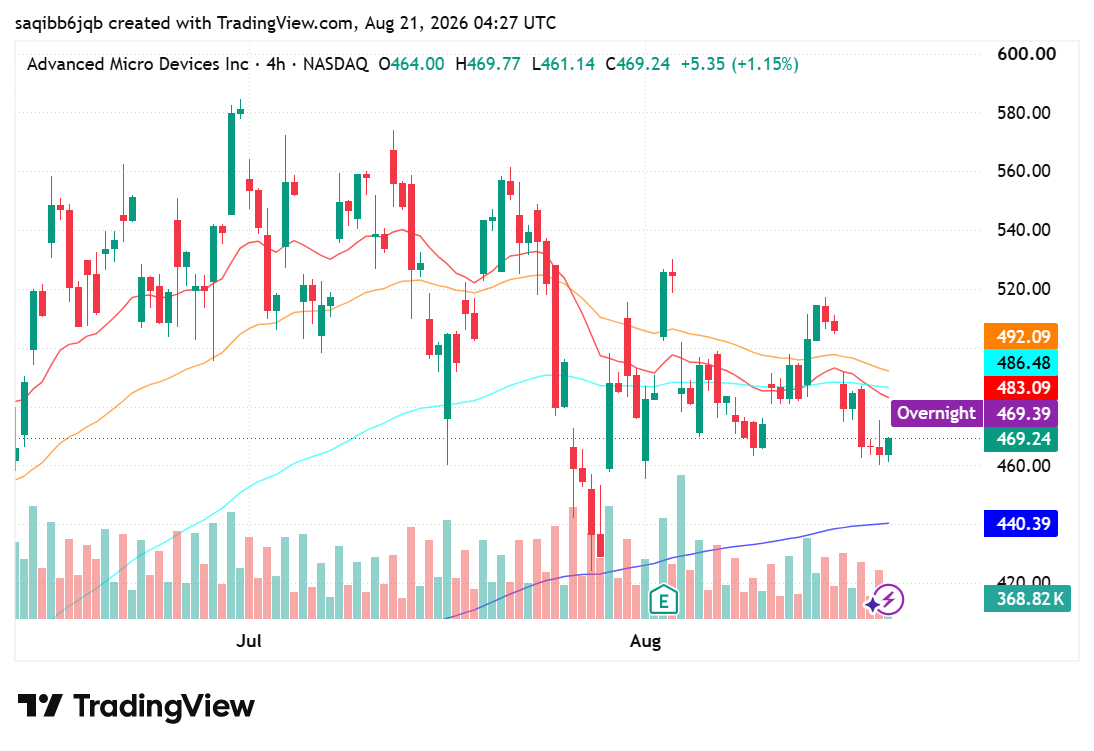
- Advanced Micro Devices trades at 469.46, up 0.65% on the day after a 461.14 to 469.77 session range.
- Second-quarter revenue rose 50% to $11.5 billion, with data centre revenue up 107% to $6.7 billion and third-quarter guidance near $13 billion.
- The 483.09 moving average is the level that decides the next move; reclaiming it would confirm the post-earnings base.
Fundamental Analysis: AMD
The 4 August second-quarter report was, on the numbers, an exceptional one. Revenue rose 50% year on year to $11.5 billion and the data centre segment more than doubled, up 107% to $6.7 billion, which now represents 58% of total company revenue. Non-GAAP diluted earnings per share came in at $1.66 on a non-GAAP gross margin of 56%, and management guided third-quarter revenue to roughly $13 billion, plus or minus $300 million.
The counterweight is what the market had already paid for that outcome. The shares peaked near 578 in late July, meaning a substantial acceleration was priced before the release, and the reaction was a sharp de-rating rather than a rally. That is the recurring pattern in AI semiconductor names this cycle: results clear the estimate but not the expectation embedded in the multiple, and the gap between the two is settled in the share price.
The balance leaves a company executing well into a market still deciding what to pay for the execution. Growth of this order is not in question, and the guidance implies further sequential acceleration. What is in question is the durability of the margin structure as competition in accelerators intensifies. That is a question only successive quarters can answer, which is why the recovery has been gradual rather than a V.
Technical Analysis: AMD
The structure is a post-earnings base. Price fell from roughly 578 in late July into the low 440s in the first week of August, then spent a fortnight carving out higher lows without ever reclaiming the broken shelf. The moving averages remain overhead in a tight band at 483.09, 486.48 and 492.09, while the slowest average has risen to 440.39 beneath price — a compression that usually resolves with a decisive move rather than more drift.
Resistance is the 483.09 average, then the 486.48 to 492.09 band where three averages converge. Support is the 461.14 session low, then the 450 area, with the slow average at 440.39 as the last defence. A four-hour close below 440.39 would break the base and reopen the early-August low.

Chasing Safety in a High-Stakes World: My Quest for the Best Low-Risk Trading Platforms
I still remember the sinking feeling in my stomach when I lost my first tiny trading account. It wasn’t a massive fortune, but it was mine. That night, I realized a brutal truth about this industry: most beginners fail not because they lack passion, but because they dive into high-risk environments without a life jacket. […]

Which Broker Has the Cleanest Interface? Real Comparison for Beginners in 2026
Looking for the cleanest trading interface in 2026? Compare Binomo, IQ Option, Quotex, Deriv, and more based on speed, layout, usability, mobile experience, and beginner friendliness. When most beginners choose a broker, they focus on bonuses, payouts, or deposit methods. But after testing multiple platforms for months, I realized something surprising: A messy interface can […]

Which Broker Has Faster Withdrawals? Real 2026 Comparison for Traders
When most beginners choose a broker, they focus on bonuses, signals, or flashy interfaces. But after trading for a while, you realize one thing matters more than almost anything else: How fast can you actually withdraw your money? A broker can look perfect until your first withdrawal request gets stuck in “processing” for three days. […]

Best Broker for $10 Deposit (Tested Platforms – 2026)
If you are starting with a $10 deposit, choosing the wrong broker will cost you more than the market itself. Most platforms look similar, but execution speed, withdrawal behavior, and usability are very different in practice. This page is designed to help you make a fast, clear decision. No unnecessary details. Only tested platforms that […]

Binomo Support Contact Guide: What to Send So You Don’t Get Copy-Paste Replies
I didn’t take support seriously until my first withdrawal got stuck. At that point, I had already made a few decent trades and felt confident. But when the money didn’t arrive, I rushed to support and sent a quick message. It felt clear to me, but the reply I received was generic and didn’t solve […]

Is Capital Core Safe or a Scam? What Day Traders Should Know Before Depositing
I’ll be honest: the first time I landed on Capital Core, I didn’t feel excited. I felt suspicious. That might sound strange coming from someone who has spent years around day trading and offshore brokers, but if you’ve traded long enough, you know the pattern. A polished homepage. Big payout claims. A low minimum deposit. […]