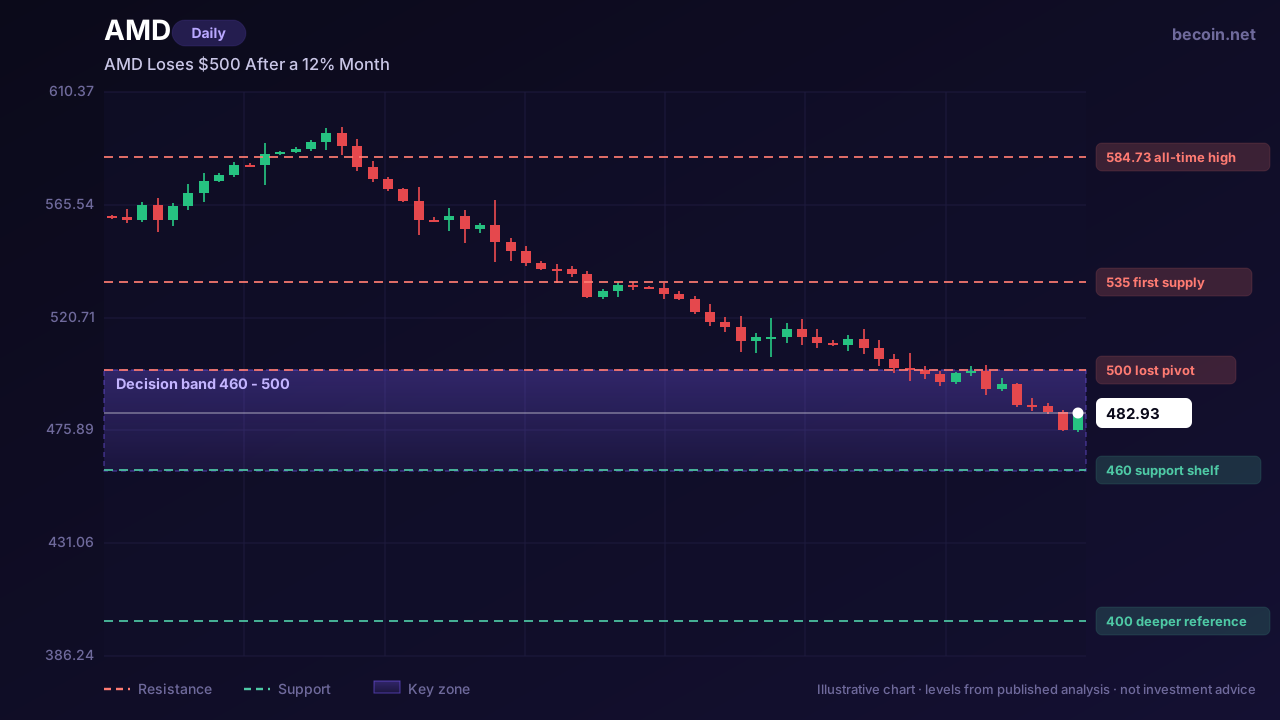
AMD Loses $500 After a 12% Month — The $460 Shelf Comes Into Play
AMD closed around $482.93, up about 1% on the day but down nearly 6% on the week and almost 13% over the past month. Zoom out and the same stock is up roughly 179% over a year, with an all-time high of $584.73 printed at the end of June. Both facts describe the position accurately, and the tension between them is exactly what the chart is now resolving.
Why $500 mattered more than it looked
Round numbers are usually overrated. This one is not, because it happens to sit almost exactly where the base of the June breakout formed. When AMD accelerated to its record, it left behind a shelf in the low $500s that acted as support on every pullback through July. Price is now below it.
That flips the level's function. What was a floor becomes a ceiling, and rallies that stall underneath it are evidence rather than noise. The stock does not need to collapse for the character of the trend to have changed — it just needs to keep failing to reclaim what it used to hold.
The AMD shelf below and the air under it
The nearest meaningful support is around $460, which is where the stock consolidated before the final leg to the highs. That is the level bulls need. It is close enough to current price to be tested quickly and it has enough history behind it to produce a genuine reaction. Our Becoin.net Premium Forecast tracks this name through each of those levels as the tape develops.
If $460 goes, the chart gets thin. The next area with real structure is closer to $400, and the distance between those two numbers is the part that should concern anyone carrying size. Stocks that have run 179% in a year do not retrace politely; they retrace to the last place a lot of shares changed hands, and on AMD's chart that is a long way below the current price.
What the bulls still have
Quite a lot, actually. The data-centre business remains the entire story, and nothing in the recent price action changes the demand backdrop that produced the move. Analysts working the bullish case point at $590 and beyond, and their argument is not unreasonable — a 13% drawdown after a 179% advance is a normal digestion, not a thesis break.
The higher-timeframe uptrend is also intact. Higher highs and higher lows on the weekly chart survive a pullback of this size comfortably. What has broken is the short-term structure, and traders should be careful not to upgrade that into a verdict on the company.
How to frame the risk
The useful framing here is not bullish or bearish, it is timeframe. On a weekly chart, this is a pullback in an uptrend and the $460 area is where you would expect it to end. On a daily chart, the stock has lost its pivot, is below its short-term averages, and is making lower highs. Those two readings coexist, and the mistake is picking one and pretending the other does not exist.
Concretely: reclaiming $500 on a daily close would repair the damage and put $535 back in view as the next friction, with the record high beyond that. Losing $460 on a close would confirm the deeper correction and make the $400 area the working reference, painful as that sounds from here.
The stock is currently between those two decisions, which means the honest answer is that there is no edge at $483. There is an edge at $500 and there is an edge at $460. Waiting for one of them is not indecision — it is the whole discipline.
Access levels for the daily level maps, scenario updates and alerts are set out on Becoin.net Tariff Plans.
This is market analysis for educational purposes and is not investment advice. Trading carries risk of loss.

Chasing Safety in a High-Stakes World: My Quest for the Best Low-Risk Trading Platforms
I still remember the sinking feeling in my stomach when I lost my first tiny trading account. It wasn’t a massive fortune, but it was mine. That night, I realized a brutal truth about this industry: most beginners fail not because they lack passion, but because they dive into high-risk environments without a life jacket. […]

The Day I Lost My First Ten Dollars: My Hunt for the Best Mobile Trading App for Beginners
I still remember the exact shape of the cloud outside my window when my first live trade ended in the red. It was a crisp morning, and I was sitting on my couch with a lukewarm cup of coffee, staring at a flashing line on my smartphone screen. I had just deposited ten bucks, convinced […]

Simple Daily Trading Routine for Consistency
Most traders do not fail because of strategy alone. They fail because they are random. They trade when emotional, skip planning, increase risk after losses, and ignore review sessions. Consistency in trading usually comes from routine more than prediction. A simple daily trading routine helps you stay disciplined, reduce emotional mistakes, and improve decision making […]

Finding the Best Trading Broker for Side Income: My Raw, First-Hand Journey to Consistent Daily Wins
Six months ago, I sat at my kitchen table staring at an accumulation of household bills, realizing my primary salary was no longer cutting it. I didn’t want a second job that required clocking into a physical location or taking endless boss mandates after hours. I needed a flexible, scalable side income. That night, I […]

Best Broker for Learning Price Action in 2026 (Tested by Real Traders)
Most traders think they need a better strategy. What they actually need is a better understanding of price. A few years ago, one of our community members had over ten indicators on his chart. RSI. MACD. Moving averages. Bollinger Bands. Stochastic. Every new YouTube video added another indicator. The result? More confusion. Not more profits. […]

Why Traders Move from Binomo to Deriv in 2026: The Real Reasons Behind the Switch
If you spend enough time around trading communities, you’ll notice a pattern. Many traders start with Binomo. Then, after a few months, a surprising number begin looking at Deriv. Some switch completely. Others keep both accounts but gradually move most of their trading activity to Deriv. I noticed this trend while talking to beginner traders […]