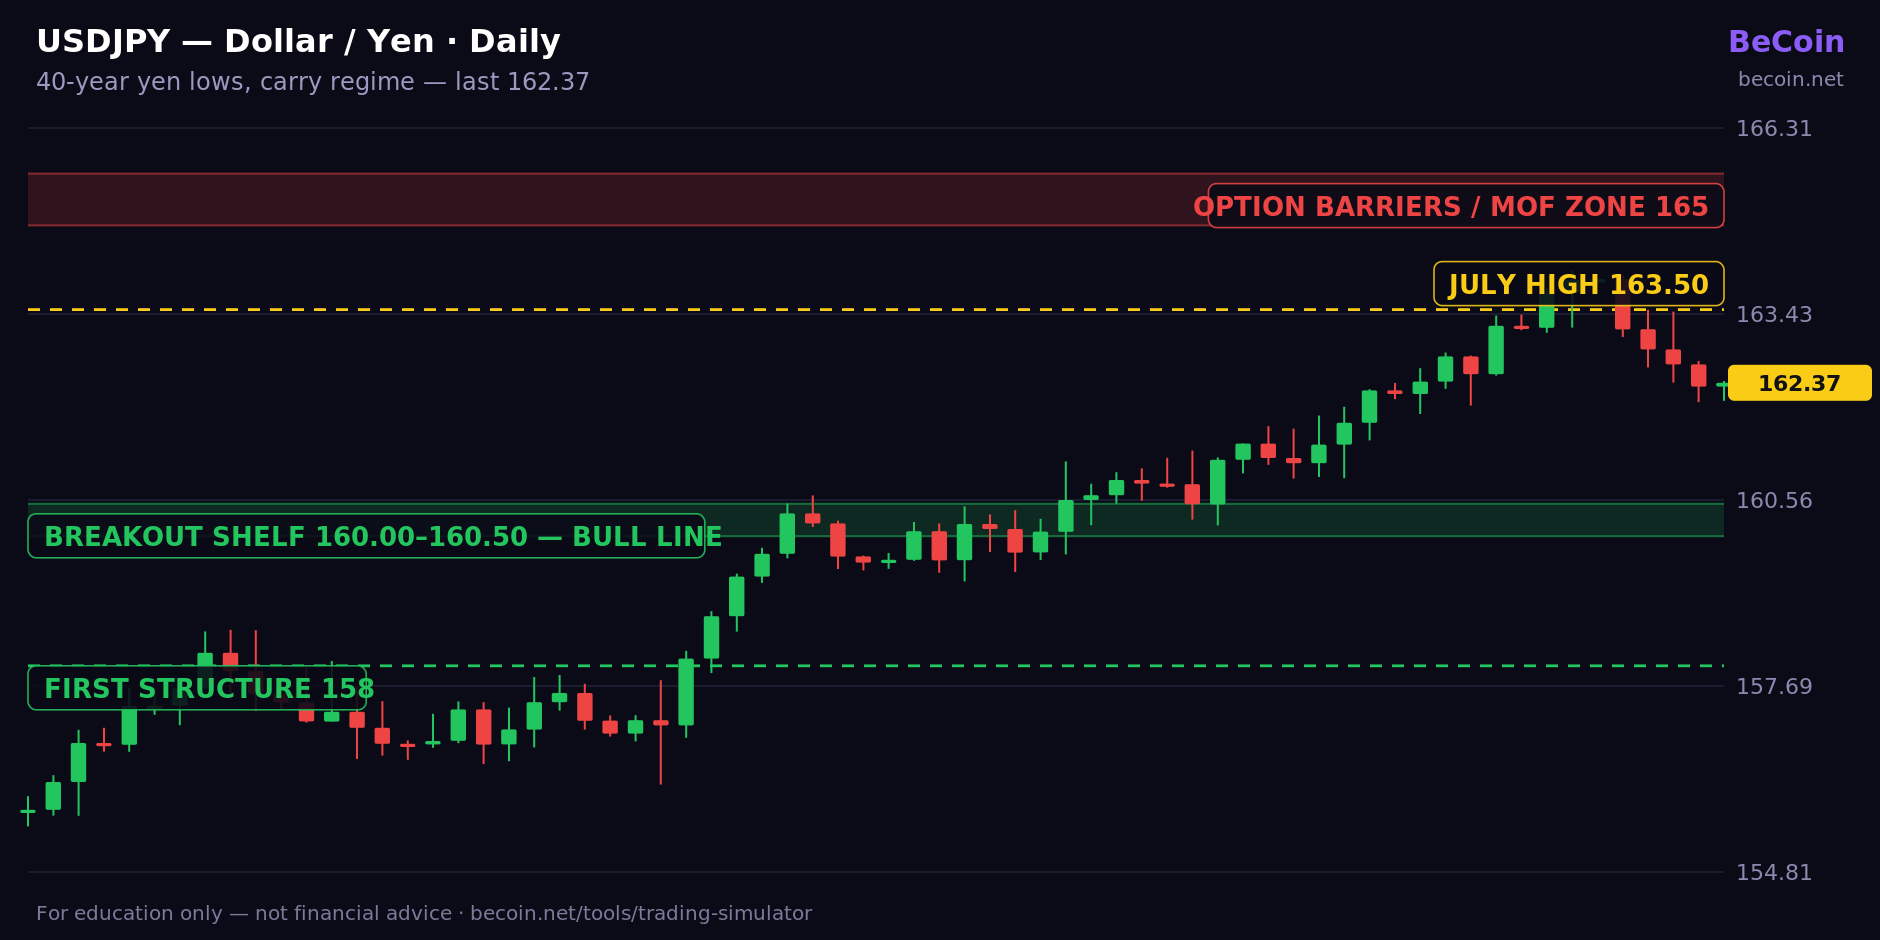
USD/JPY at 162.37: the yen sits at 40-year lows and the market dares Tokyo to act
USD/JPY held at 162.37 on Friday, essentially flat on the week, keeping the yen pinned at levels last seen four decades ago. What makes the stillness notable: US front-end yields just fell on soft CPI and PPI prints — the exact catalyst that should knock a rate-differential trade lower — and the pair barely blinked.
Why it matters
When a currency pair stops responding to its own driver, positioning has taken over from fundamentals. The yen carry trade — borrow at Japan's still-negligible rates, park in 4%+ dollars — has become one of the most crowded trades in global macro, and crowded trades ignore friendly data until they violently don't. Every session above 160 also raises the odds of the other catalyst: Japan's Ministry of Finance has a documented history of stepping in when moves turn "one-sided," and the rhetoric from Tokyo has been escalating for weeks. Intervention doesn't change trend — 2022 and 2024 proved that — but it produces 300–500 pip air pockets that liquidate late longs in minutes.
Technical analysis
The trend is an unbroken staircase of higher lows since spring; the pair is overbought on the weekly but has been for a month — overbought is not a signal in a carry regime. Support sits at 160.00–160.50, the breakout shelf and the round number the market now treats as the bull line; below it, 158 is the first real structure. Resistance is only air and fear: 163.50 (this month's high) then the 165 zone, where option barriers cluster and where most desks assume Tokyo's tolerance ends. Realized volatility is compressing at the highs — historically the calm before either the next leg or the MOF headline.
BeCoin's forecast read
The model's 24-hour path is flat with an upward drift bias — carry momentum decays slowly — but its weekly distribution is deliberately fat-tailed here: it prices a meaningful probability of a 300+ pip intervention-style drop from anywhere above 162, against a grinding climb toward 165 otherwise. Its practical translation: longs above 160 are renting, not owning. The model's live FX reads update daily on the BeCoin forecast page.
See where it goes next. BeCoin's AI model forecasts USD/JPY across six horizons — tomorrow to 10 years — and fires signals the moment they trigger. Get full access to all 100+ assets → · Educational only — not financial advice.

The Clock and the Candle: How I Stopped Guessing the Best Time to Trade Day Trading
I still remember the night I blew my third trading account. It was 11:30 PM. The house was completely quiet, the market charts on my screen were barely crawling, and I was forcing trades out of pure impatience. I kept staring at a flatline asset, placing one-minute positions, convinced that the market owed me a […]

Bitcoin slips to $65,741 as oil and yields test the breakout
Bitcoin is near $65,741 as rising oil and Treasury yields test the $65.7K breakout floor. Here are the levels that confirm or invalidate the move.

Trading Currency Strength Instead of Single Pairs
It was a Tuesday afternoon when I realized I was fighting a losing battle against a ghost. My screen was a chaotic web of indicators. I had the EUR/USD chart open, a moving average crossing over here, a relative strength index flashing oversold there, and a price action setup that looked textbook perfect. I clicked […]

How Understanding Market Structure Saved My Day Trading
I remember the exact moment my trading account hit zero for the third time in a single month. It was a rainy Tuesday evening, and I was staring at a 1-minute chart on my laptop screen. The price had been moving up aggressively. It looked like a flawless rocket ship to the moon. I clicked […]

Why Market Open Hours Create the Best Trading Opportunities
I used to think trading was a 24-hour conveyor belt of endless cash. In my earliest days, armed with a laptop, a hot cup of coffee, and far too much unearned confidence, I would stare at charts at 11:00 PM on a Tuesday. The candles barely moved. They crawled across my screen like snails on […]

The Clock and the Cash: My Journey into the Hidden Rhythm of Session-Based Trading
There was a time when I thought the global financial market was a single, monstrous wave that never stopped moving. I believed that if I sat in front of my monitors long enough, clicking buttons whenever a pretty pattern appeared on my charts, the market would eventually reward my sheer endurance. I was dead wrong. […]