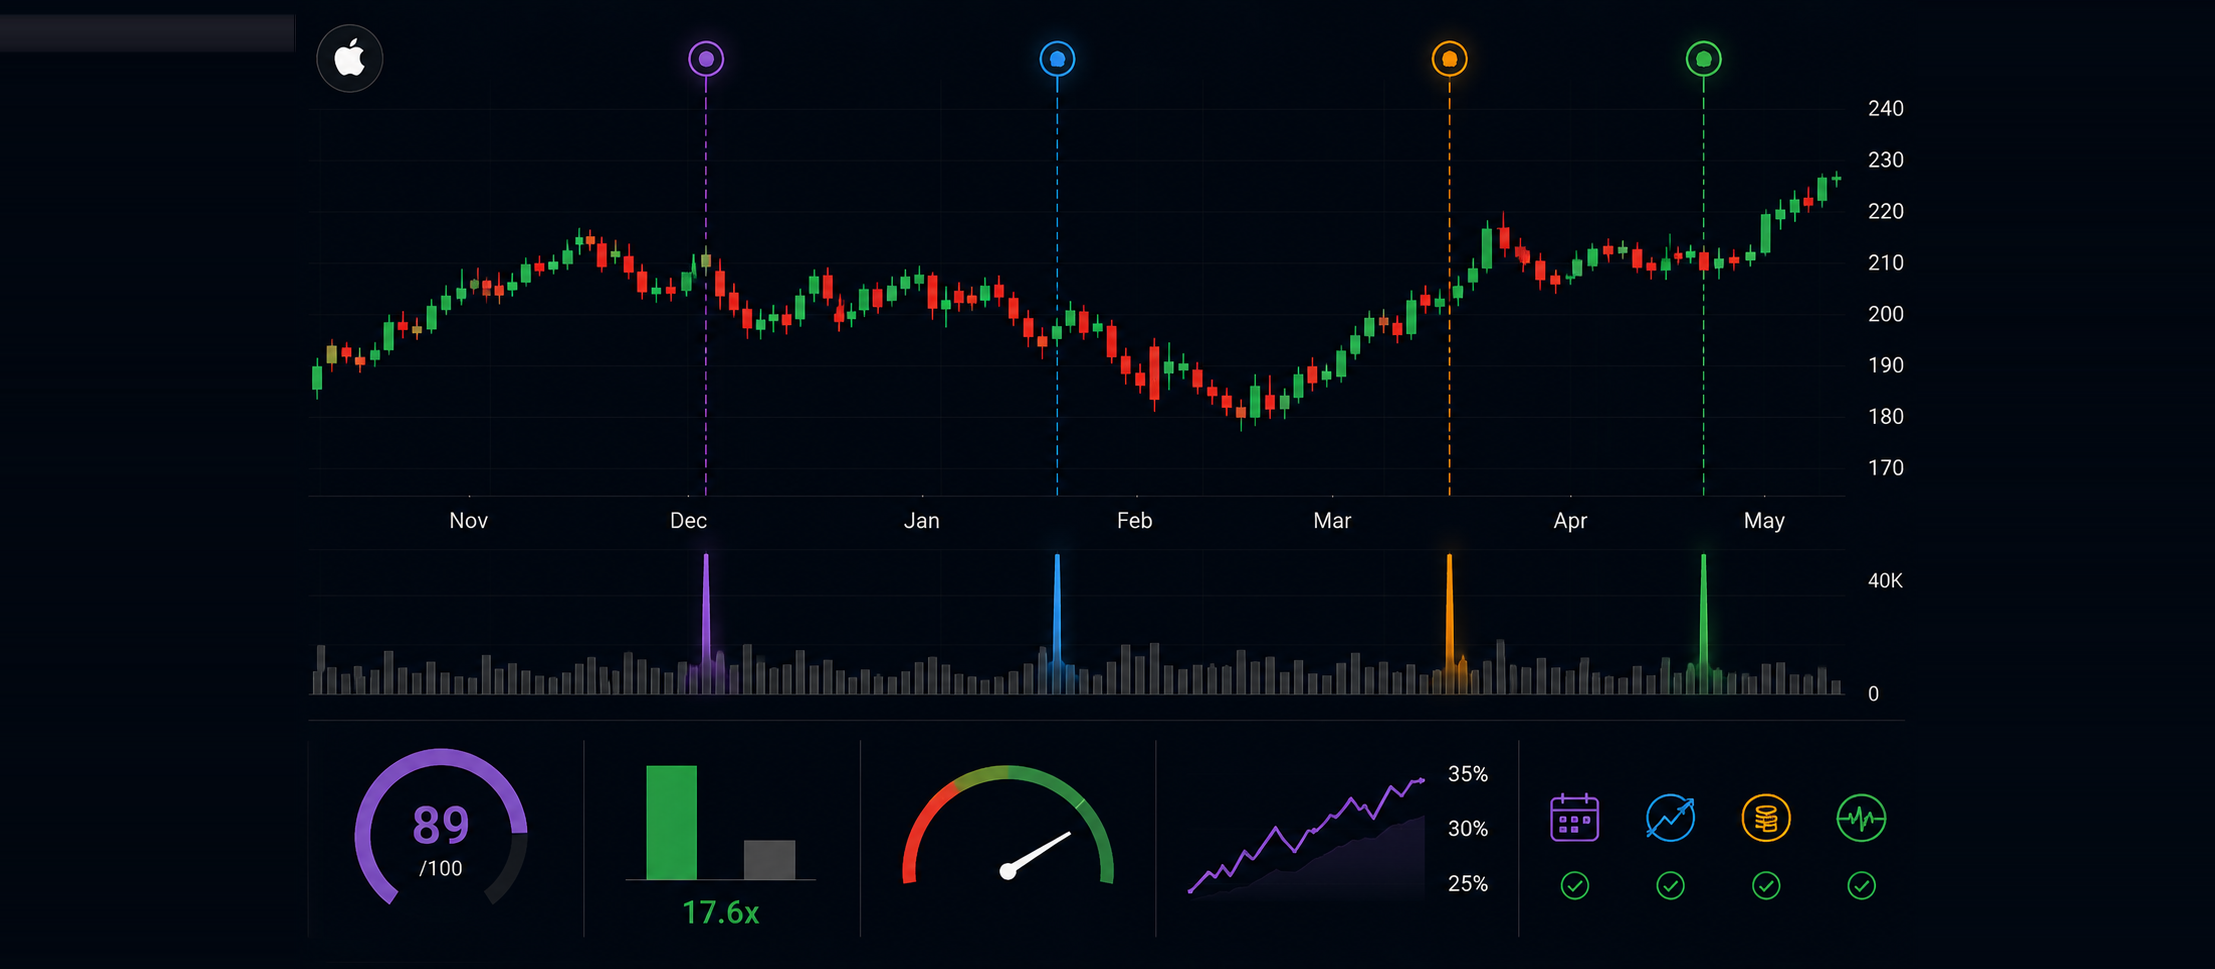
Unusual Options Volume Without News: What It Can and Cannot Tell You
Screens that flag large options trades have become a fixture of retail market coverage, usually accompanied by the suggestion that somebody knows something. Occasionally that is true. Far more often the print is a hedge, a roll, a spread leg reported separately, or a dealer laying off risk. The interesting question is not whether unusual activity is a signal, because on its own it is not. The interesting question is what additional conditions have to be present before the data means anything.
What unusual options volume actually measures
The standard definition compares a contract's traded volume against its own recent average or against its open interest. Volume far exceeding open interest is the more informative version, because it indicates new positioning rather than turnover of existing exposure. What the measure cannot tell you is intent. A trade tape shows size, strike, expiry and price, but it does not show whether the buyer was opening a speculative position, hedging a stock holding, closing an old trade or completing one leg of a structure whose other legs printed elsewhere.
The checks that make the data usable
Several filters remove most of the noise. Comparing volume to open interest at the specific strike separates new exposure from recycled contracts. Checking whether the trade printed at the bid or the offer suggests whether it was initiated by a buyer or a seller. Looking for simultaneous prints in other strikes or expiries reveals spreads that would otherwise look like outright bets. Examining the underlying stock's borrow cost and dividend calendar identifies trades driven by financing rather than by a view. And checking whether implied volatility rose alongside the volume shows whether the market repriced or simply transacted.
When the activity is worth adding to a watchlist
Activity becomes research-worthy when several conditions coincide: volume many times open interest, concentrated in a single expiry rather than scattered, accompanied by a genuine rise in implied volatility for that expiry, occurring in a name with no scheduled catalyst that would explain routine hedging, and repeated across more than one session. That combination does not reveal what anyone knows, but it does show that the market has changed what it is willing to pay for exposure at a particular horizon, and that is worth monitoring.
What the data cannot tell you
It is worth being blunt about the limits. Options activity cannot confirm insider knowledge, and the overwhelming majority of large prints are institutional risk management. It cannot tell you direction, because a large call purchase may be a hedge against a short stock position. It cannot tell you conviction, because notional size scales with the size of the fund rather than with confidence. And it cannot tell you timing, since the same expiry can be reached by many different paths.
What would invalidate a watchlist built this way
If names flagged by the screen show no subsequent change in realised volatility relative to the broader market over several weeks, the screen is capturing hedging flow rather than information. If the flagged activity consistently reverses within days, the prints were probably rolls. And if the data provider aggregates multi-leg trades as single prints, the entire screen is measuring something other than what it claims. Testing the screen against its own history is the only way to know which of these applies.
Becoin.net Tariff Plans ---> Here
Using it as a monitoring tool
Treated properly, unusual options activity is a way to decide what to look at rather than what to do. It narrows a universe of thousands of names to a handful worth researching, and it tells you which horizon the market is pricing differently. It is not a recommendation engine, and nothing in this article suggests buying or selling any security or contract.

Deriv vs IQ Option for Synthetic Indices: Which Platform Is Better in 2026?
Synthetic indices have become one of the most talked about trading categories among beginners and experienced traders alike. Unlike forex or crypto markets that depend on real world events, synthetic indices operate 24/7 using algorithm driven price movements. That means traders can access opportunities at any time without waiting for market openings or major news […]
Which Is Easier for Beginners: Binomo or IQ Option?
For most beginners, the hardest part of trading is not strategy. It is surviving the first few months without blowing the account from emotional decisions, overtrading, and poor risk management. That is why choosing the right platform matters more than many new traders realize. Two names dominate beginner conversations in binary and short-term trading: Binomo […]
Best Broker Without KYC (2026) — Truth + Risks Before You Choose
If you’re searching for the best broker without KYC, you likely want speed, low friction, and fast access to trading. But here’s the reality: Most traders don’t lose because of strategy.They lose because they choose the wrong platform early. No-KYC brokers can help you start quickly — but they also introduce hidden risks around withdrawals, […]

Trading Currency Strength Instead of Single Pairs
It was a Tuesday afternoon when I realized I was fighting a losing battle against a ghost. My screen was a chaotic web of indicators. I had the EUR/USD chart open, a moving average crossing over here, a relative strength index flashing oversold there, and a price action setup that looked textbook perfect. I clicked […]

How Many People Own Bitcoin? (2026 Data, Charts & Country Breakdown)
About 365 million people owned Bitcoin in 2025 - roughly 4-4.5% of the world and nearly half of all crypto owners. See the year-by-year growth curve, country data, whole-coin rarity, and why estimates disagree.
Chasing Safety in a High-Stakes World: My Quest for the Best Low-Risk Trading Platforms
I still remember the sinking feeling in my stomach when I lost my first tiny trading account. It wasn’t a massive fortune, but it was mine. That night, I realized a brutal truth about this industry: most beginners fail not because they lack passion, but because they dive into high-risk environments without a life jacket. […]