SoFi Reclaimed Its 200-Day Moving Average — Now It Has to Deal With 20
A rare case where the chart is behind the business
Most of the time the market is ahead of the fundamentals. Occasionally it is behind, and SoFi looks like one of those occasions. The stock has run more than twenty percent off its earnings reaction and has climbed back above the 200-day moving average it spent most of the year beneath, and it is still down substantially year to date.
That combination, improving numbers with a lagging price, is what makes the setup worth examining rather than dismissing as a bounce.
What changed in the numbers
The most recent quarter moved in the right direction across essentially every line that matters for a company at this stage. Revenue growth accelerated into the forty percent range year over year, net income expanded meaningfully, loan originations hit a record, and member growth was the strongest in the company's history, pushing the total base up by more than a third from a year ago. Tangible book value grew sharply, and management raised full-year guidance on the back of it.
The company has also pushed into digital-asset services, which broadens the product surface but adds regulatory exposure that did not exist a year ago. That is a genuine two-sided development, not an unambiguous positive.
The SoFi technical picture
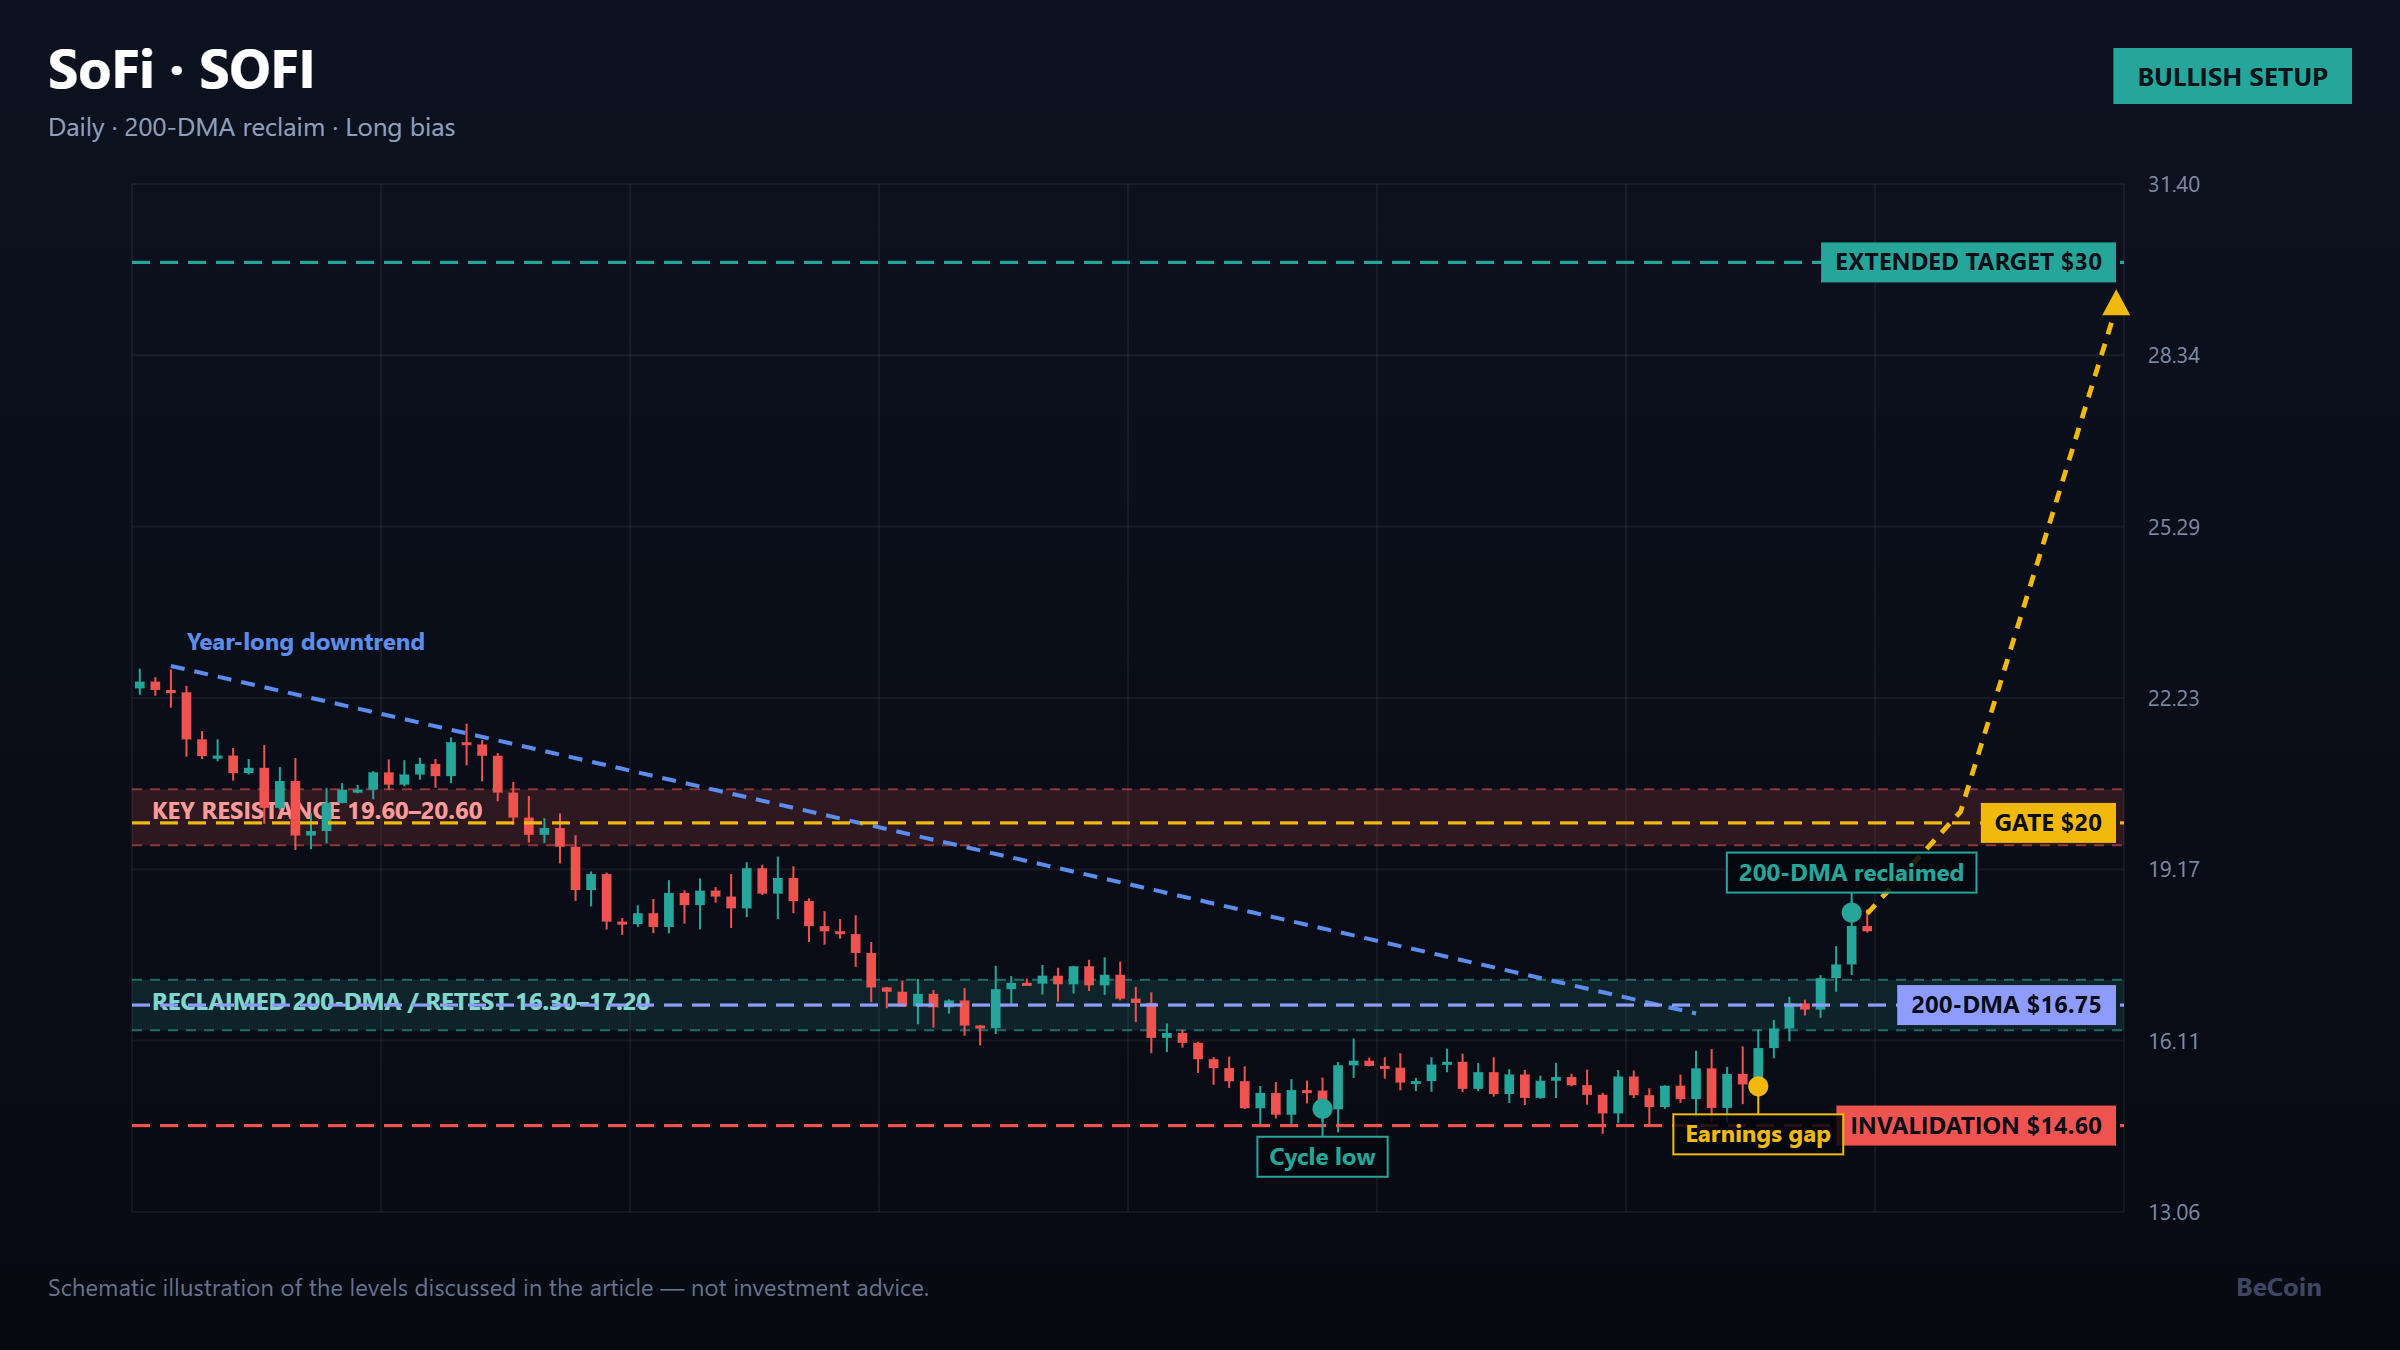
The reclaim of the 200-day is the structural event here. A stock that spends most of a year under its long-term average and then closes above it is signalling a change in who is in control, provided the level then holds on a pullback. That retest is the first thing to watch.
Above, the obvious obstacle is the 20 dollar area. That level acted as support before the late-cycle top and has since flipped to resistance, which is the standard behaviour. Clearing it on a closing basis, and holding it, opens a wide zone with very little overhead structure until the low 30s, which is where the stock last traded with any real volume.
The risk that nobody prices until it arrives
SoFi is a lender. Credit quality is the variable that turns a growth story into a value trap, and it deteriorates slowly and then all at once. Charge-off trends and provisioning are worth more attention than member growth for anyone holding this beyond a swing timeframe.
The second risk is simpler: a stock that has already run twenty percent into resistance is not a low-risk entry. Chasing strength into a known supply level is how good theses turn into bad trades.
How the levels frame it
The pullback zone to watch sits around the reclaimed 200-day, roughly the mid-16 to 17 area. That is where a retest would offer defined risk. Resistance is 20. The extended objective is 30, and the honest note about that number is that it is a destination rather than a forecast, contingent on the fundamentals continuing to compound.
Bottom line
SoFi has reclaimed its 200-day moving average with fundamentals that support the move rather than contradict it. The 20 dollar level is the gate. Clearing and holding it points toward the low 30s over time; failing there sends the stock back to retest the moving average, which is where the bullish case would need to be defended.
Becoin.net Premium Forecast - Becoin.net Tariff Plans
This article is educational market commentary and is not investment advice. Do your own research and manage risk accordingly.

Best Broker for Learning Price Action in 2026 (Tested by Real Traders)
Most traders think they need a better strategy. What they actually need is a better understanding of price. A few years ago, one of our community members had over ten indicators on his chart. RSI. MACD. Moving averages. Bollinger Bands. Stochastic. Every new YouTube video added another indicator. The result? More confusion. Not more profits. […]

Which Broker Has Faster Withdrawals? Real 2026 Comparison for Traders
When most beginners choose a broker, they focus on bonuses, signals, or flashy interfaces. But after trading for a while, you realize one thing matters more than almost anything else: How fast can you actually withdraw your money? A broker can look perfect until your first withdrawal request gets stuck in “processing” for three days. […]

Which Is Easier for Beginners: Binomo or IQ Option?
For most beginners, the hardest part of trading is not strategy. It is surviving the first few months without blowing the account from emotional decisions, overtrading, and poor risk management. That is why choosing the right platform matters more than many new traders realize. Two names dominate beginner conversations in binary and short-term trading: Binomo […]

Simple Daily Trading Routine for Consistency
Most traders do not fail because of strategy alone. They fail because they are random. They trade when emotional, skip planning, increase risk after losses, and ignore review sessions. Consistency in trading usually comes from routine more than prediction. A simple daily trading routine helps you stay disciplined, reduce emotional mistakes, and improve decision making […]

Trading Currency Strength Instead of Single Pairs
It was a Tuesday afternoon when I realized I was fighting a losing battle against a ghost. My screen was a chaotic web of indicators. I had the EUR/USD chart open, a moving average crossing over here, a relative strength index flashing oversold there, and a price action setup that looked textbook perfect. I clicked […]

Which Broker Has the Cleanest Interface? Real Comparison for Beginners in 2026
Looking for the cleanest trading interface in 2026? Compare Binomo, IQ Option, Quotex, Deriv, and more based on speed, layout, usability, mobile experience, and beginner friendliness. When most beginners choose a broker, they focus on bonuses, payouts, or deposit methods. But after testing multiple platforms for months, I realized something surprising: A messy interface can […]