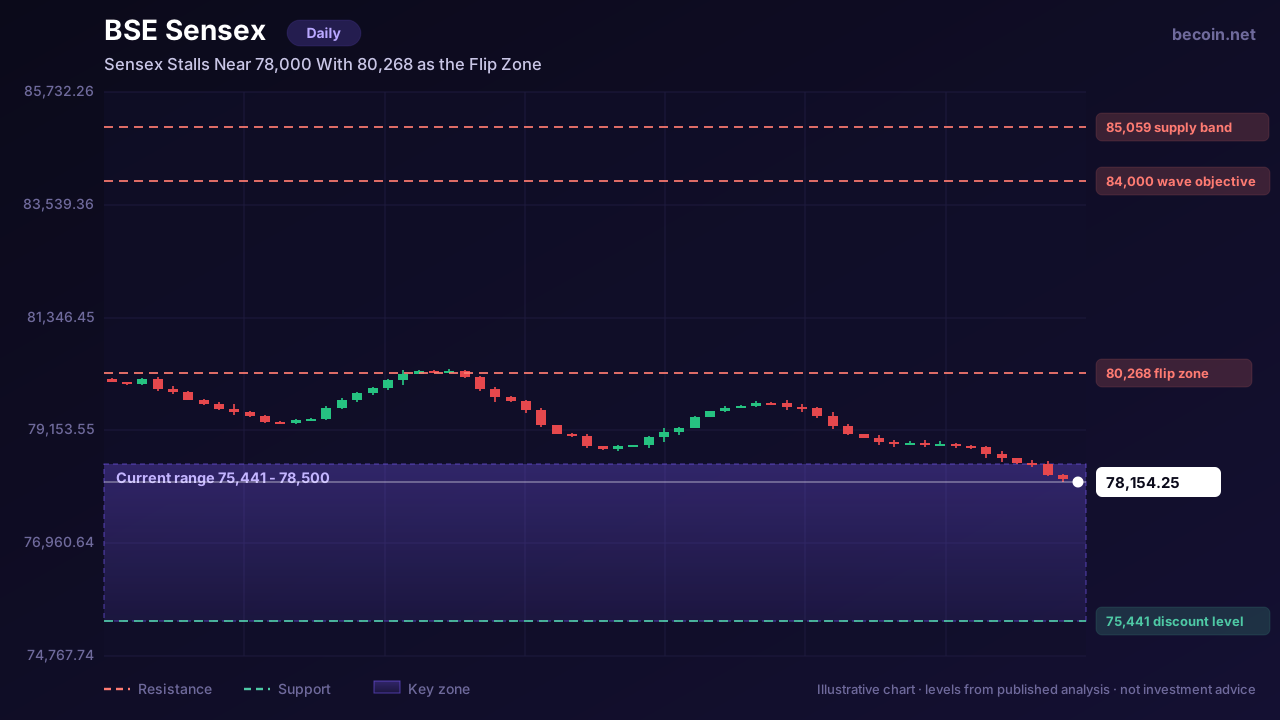
Sensex Stalls Near 78,000 With 80,268 as the Flip Zone
The Sensex is trading around 78,154, down roughly 1.2% on the day and over the week, up a little over 1% on the month and down more than 10% year to date. Its record of 86,159.02, set on 1 December 2025, is now about 9% overhead. In a year where several developed-market benchmarks have printed all-time highs, India's flagship index has been going the other way.
Why the drawdown is orderly
It is worth being precise about what has happened. This is not a crash. The index has spent the year grinding lower in a series of overlapping ranges rather than falling in a straight line, and it has repeatedly found buyers on the way down. A 10% year-to-date decline distributed over eight months is a de-rating, not a dislocation.
The distinction matters because orderly declines behave differently from panicked ones. They tend to end with a base rather than a spike low, they give more warning when they turn, and they respond to levels rather than to exhaustion. That is exactly what the current chart shows.
The flip zone at 80,268
The number that keeps appearing in analyst work on this index is roughly 80,268. It is the level where the market last flipped from supporting price to capping it, which makes it the single most useful reference on the chart. Below it, every rally is a retracement inside a downtrend. Above it, on a closing basis, the structure of the year changes and the index has genuinely turned. Our Becoin.net Premium Forecast follows this index through each of those levels session by session.
Currently, price sits about 2,100 points beneath it. That is not far, but it is far enough that the index needs a catalyst rather than drift to get there. Reclaiming a flip zone is one of the more reliable trend-change signals available precisely because it requires the market to overcome the supply that created the level in the first place.
The band that ended the last advance
Above the flip zone, the 85,059 to 85,875 area is where the previous advance topped out and where the heaviest overhead supply sits. Several Elliott Wave analysts working this index point at 84,000 as an interim technical objective, which sits just under that band and is consistent with it.
Sequencing matters here. The index cannot reasonably target 84,000 while trading below 80,268. Traders who anchor on the higher number while price is still in the lower range end up holding through drawdowns that the chart told them to expect.
Where the Sensex downside case begins
The bearish scenario is equally well defined. Below current levels, around 75,441 is the reference most analysts are using as the discounted zone — roughly the midpoint of the entire advance that preceded this correction, and the natural place for a deeper flush to find buyers. Some of the more constructive analysts explicitly want that level, framing it as the accumulation zone rather than a breakdown.
That framing is useful. A test of 75,441 would not necessarily be bad news for the index; it would be the completion of a correction that has so far been shallow relative to its duration. Corrections that go sideways for a long time without a proper flush often need one before they can end.
Reading it simply
Three numbers organise the whole chart. Below 75,441, the correction is deepening and the multi-year structure comes into question. Between 75,441 and 80,268, the index is doing what it has done all year — ranging, frustrating, and offering very little to trend traders. Above 80,268 on a close, the year's downtrend is over and 84,000 becomes a reasonable objective.
Everything else is commentary.
Access levels for the daily level maps, scenario updates and alerts are set out on Becoin.net Tariff Plans.
This is market analysis for educational purposes and is not investment advice. Trading carries risk of loss.

Which Broker Has Faster Withdrawals? Real 2026 Comparison for Traders
When most beginners choose a broker, they focus on bonuses, signals, or flashy interfaces. But after trading for a while, you realize one thing matters more than almost anything else: How fast can you actually withdraw your money? A broker can look perfect until your first withdrawal request gets stuck in “processing” for three days. […]

Deriv vs Binomo for Low-Risk Trading in 2026: Which Platform Is Better for Safer Growth?
Most beginners enter trading with one simple goal: avoid blowing up their account in the first week. That is exactly why low-risk trading matters more than fast profits. Two platforms that constantly appear in beginner discussions are Deriv and Binomo. Both allow small deposits, short-term trading, and beginner-friendly access. But when your focus is protecting […]

Which Is Easier for Beginners: Binomo or IQ Option?
For most beginners, the hardest part of trading is not strategy. It is surviving the first few months without blowing the account from emotional decisions, overtrading, and poor risk management. That is why choosing the right platform matters more than many new traders realize. Two names dominate beginner conversations in binary and short-term trading: Binomo […]

Simple Daily Trading Routine for Consistency
Most traders do not fail because of strategy alone. They fail because they are random. They trade when emotional, skip planning, increase risk after losses, and ignore review sessions. Consistency in trading usually comes from routine more than prediction. A simple daily trading routine helps you stay disciplined, reduce emotional mistakes, and improve decision making […]
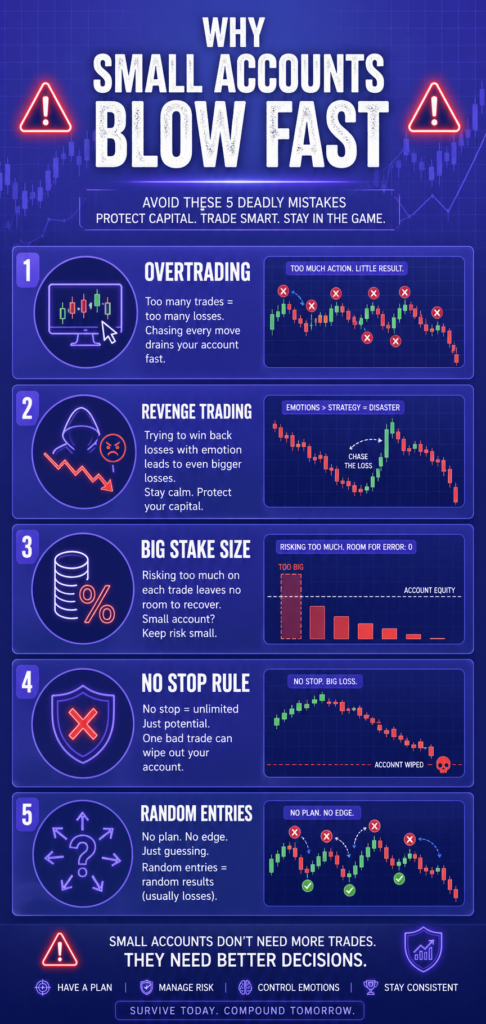
Risk Management for Small Accounts ($10–$50)
Starting with a small trading account can feel frustrating. You want fast growth, but one bad decision can wipe out weeks of progress. That is why risk management matters more for a $10 account than for a $1,000 account. Many beginners focus only on strategy. They search for the best indicators, signals, or entry methods. […]
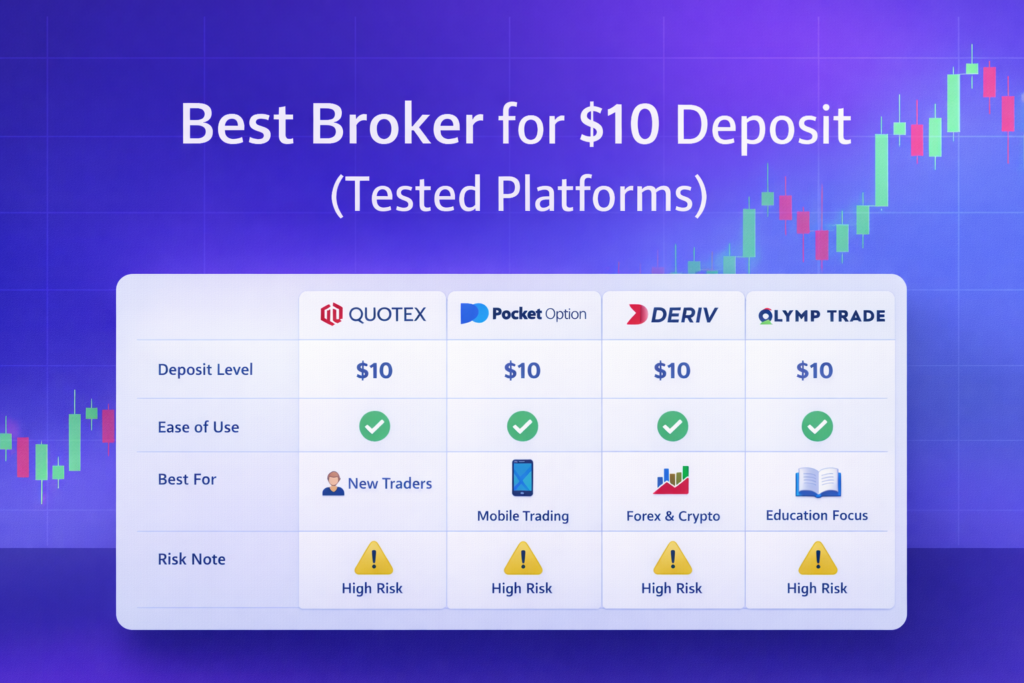
Best Broker for $10 Deposit (Tested Platforms – 2026)
If you are starting with a $10 deposit, choosing the wrong broker will cost you more than the market itself. Most platforms look similar, but execution speed, withdrawal behavior, and usability are very different in practice. This page is designed to help you make a fast, clear decision. No unnecessary details. Only tested platforms that […]