Polkadot Forecast: DOT Coils Above $1.24 With $1.75 Capping It
The most patient base in the large-cap altcoin space
Polkadot has been an exercise in frustration for holders and an exercise in discipline for traders. The token has spent the better part of a year carving out a wide, flat base between roughly $1.20 and $1.75, absorbing supply from an exhausted holder cohort and refusing to either break down or break out. Most participants have stopped watching, which is usually when these structures start to matter.
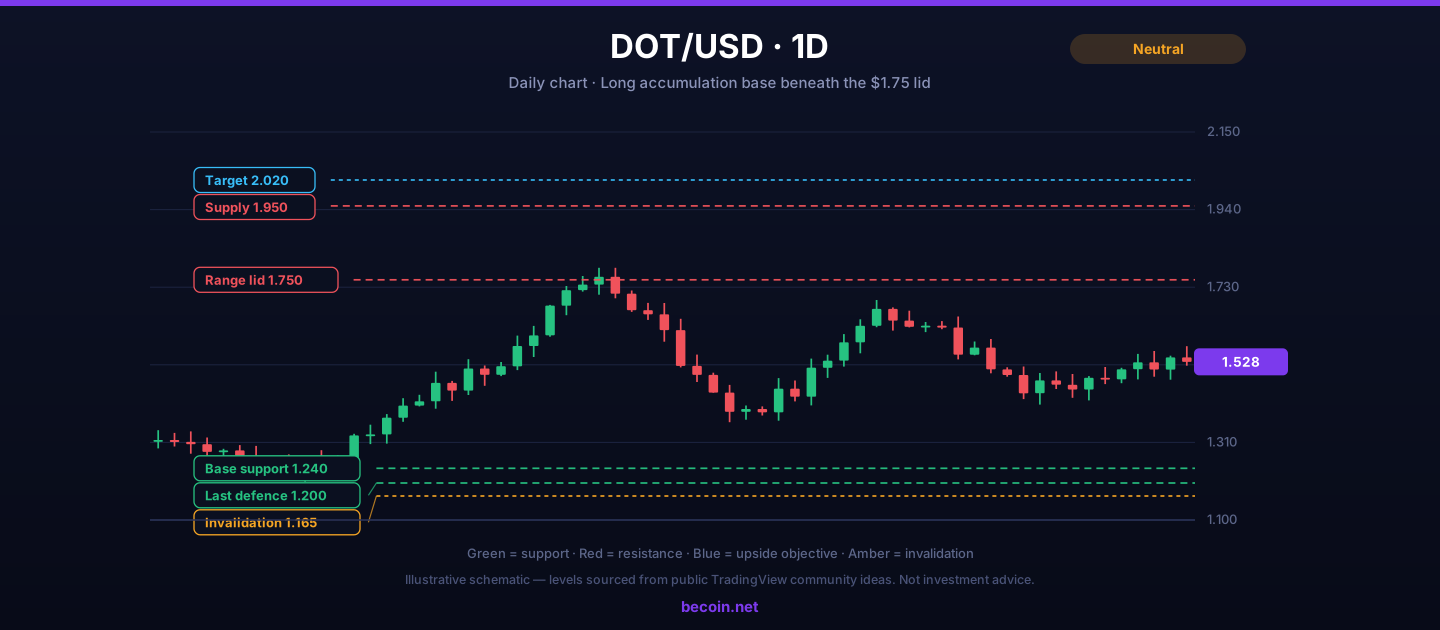
The technical read is simple. Every attempt below $1.24 has been bought. Every attempt above $1.75 has been sold. The range has narrowed slightly over the past two months, which is the first mild evidence that the balance is shifting rather than simply persisting.
What the Polkadot forecast depends on
The map is unusually tidy for an altcoin:
- $1.24 is the working base. Multiple wicks have tested it and none have closed beneath it on a daily basis.
- $1.20 is the last real defence. Beneath it there is very little structure until the prior cycle lows.
- $1.75 is the lid. It has rejected price at least four times and is the single most important number on this chart.
- $1.95 to $2.02 is the first meaningful objective if the lid breaks, and it lines up with an old consolidation shelf.
The breakout case
A daily close above $1.78 with a subsequent successful retest would confirm the base. The measured move from a range of this width projects toward $2.20 to $2.30, though the intermediate stop at $2.02 is where most of the realistic profit-taking sits.
What would make that break credible is participation from the ecosystem itself. Polkadot spent this cycle rebuilding its architecture around elastic scaling and a simplified coretime model. If activity metrics start rising alongside price, the break has a story behind it. If price moves alone, treat it as a liquidity event rather than a trend change.
Entry structure
The lower-risk entry is a pullback into $1.28 to $1.32 with invalidation beneath $1.20. That risks about eleven cents to target the range lid, which is roughly a three-to-one structure. The alternative is the confirmed break, entering on the retest of $1.75 rather than on the break itself.
The bearish case
A daily close beneath $1.165 ends the base. Below that level the chart has almost no reference points, and altcoins that lose a year-long base tend to move fast because there is nobody left defending anything. That is the tail risk here, and it is why position sizing matters more than conviction.
The slower failure is simply more time. If the range persists for another two quarters, the opportunity cost of holding through it exceeds what most traders can justify, even if the eventual resolution is higher.
The wider context
Large-cap altcoins with long histories tend to lag early in a recovery and catch up violently late in one. Polkadot fits that profile. It will not lead a rally, but if broad crypto risk appetite returns and Bitcoin dominance starts falling, tokens in this exact position are the ones that produce the outsized percentage moves.
Anyone tracking that rotation across the wider market can follow updated digital asset projections through the Becoin.net Premium Forecast, with the access levels set out on the Becoin.net Tariff Plans page.
How to hold it without getting hurt
Range trades fail when traders treat them as trend trades. The discipline here is to buy the lower third of the range, sell the upper third, and only convert to a position trade after the lid has broken and held. Averaging down through $1.20 because the base looked good is how a defined-risk idea becomes an open-ended loss.
Keep the stop mechanical and beneath the structure rather than beneath a round number, since $1.20 is exactly where a liquidity sweep would be aimed.
The bottom line
Polkadot is a long, well-defined base with a hard lid at $1.75 and a floor at $1.24. It is not a trend yet, and pretending otherwise is the main way to lose money on it. Trade the edges, wait for the daily close above $1.78, and respect $1.165 as the point where the thesis is simply wrong.
This analysis is educational and does not constitute investment advice. Digital assets are highly volatile and carry substantial risk of loss.

Finding the Best Trading Broker for Side Income: My Raw, First-Hand Journey to Consistent Daily Wins
Six months ago, I sat at my kitchen table staring at an accumulation of household bills, realizing my primary salary was no longer cutting it. I didn’t want a second job that required clocking into a physical location or taking endless boss mandates after hours. I needed a flexible, scalable side income. That night, I […]

The Best Broker Without Complicated Features (And Why Simplicity Wins)
Most traders don’t fail because they lack knowledge. They fail because their platform buries them in noise before they even place their first trade. Here’s what actually works. It Started With a Confession From a $10 Trader A reader messaged us a few months back. He had been trying to trade for three weeks, had […]

Which Broker Has the Cleanest Interface? Real Comparison for Beginners in 2026
Looking for the cleanest trading interface in 2026? Compare Binomo, IQ Option, Quotex, Deriv, and more based on speed, layout, usability, mobile experience, and beginner friendliness. When most beginners choose a broker, they focus on bonuses, payouts, or deposit methods. But after testing multiple platforms for months, I realized something surprising: A messy interface can […]

Binomo vs IQ Option Withdrawal Speed: Full 2026 Comparison Guide
Withdrawal speed is one of the most important factors for traders, especially beginners who want quick access to profits. A platform may look good for trading, but if getting your money takes too long, frustration builds fast. In this detailed comparison of Binomo and IQ Option, we will break down real withdrawal timelines, processing behavior, […]

Which Is Easier for Beginners: Binomo or IQ Option?
For most beginners, the hardest part of trading is not strategy. It is surviving the first few months without blowing the account from emotional decisions, overtrading, and poor risk management. That is why choosing the right platform matters more than many new traders realize. Two names dominate beginner conversations in binary and short-term trading: Binomo […]

Is Capital Core Safe or a Scam? What Day Traders Should Know Before Depositing
I’ll be honest: the first time I landed on Capital Core, I didn’t feel excited. I felt suspicious. That might sound strange coming from someone who has spent years around day trading and offshore brokers, but if you’ve traded long enough, you know the pattern. A polished homepage. Big payout claims. A low minimum deposit. […]