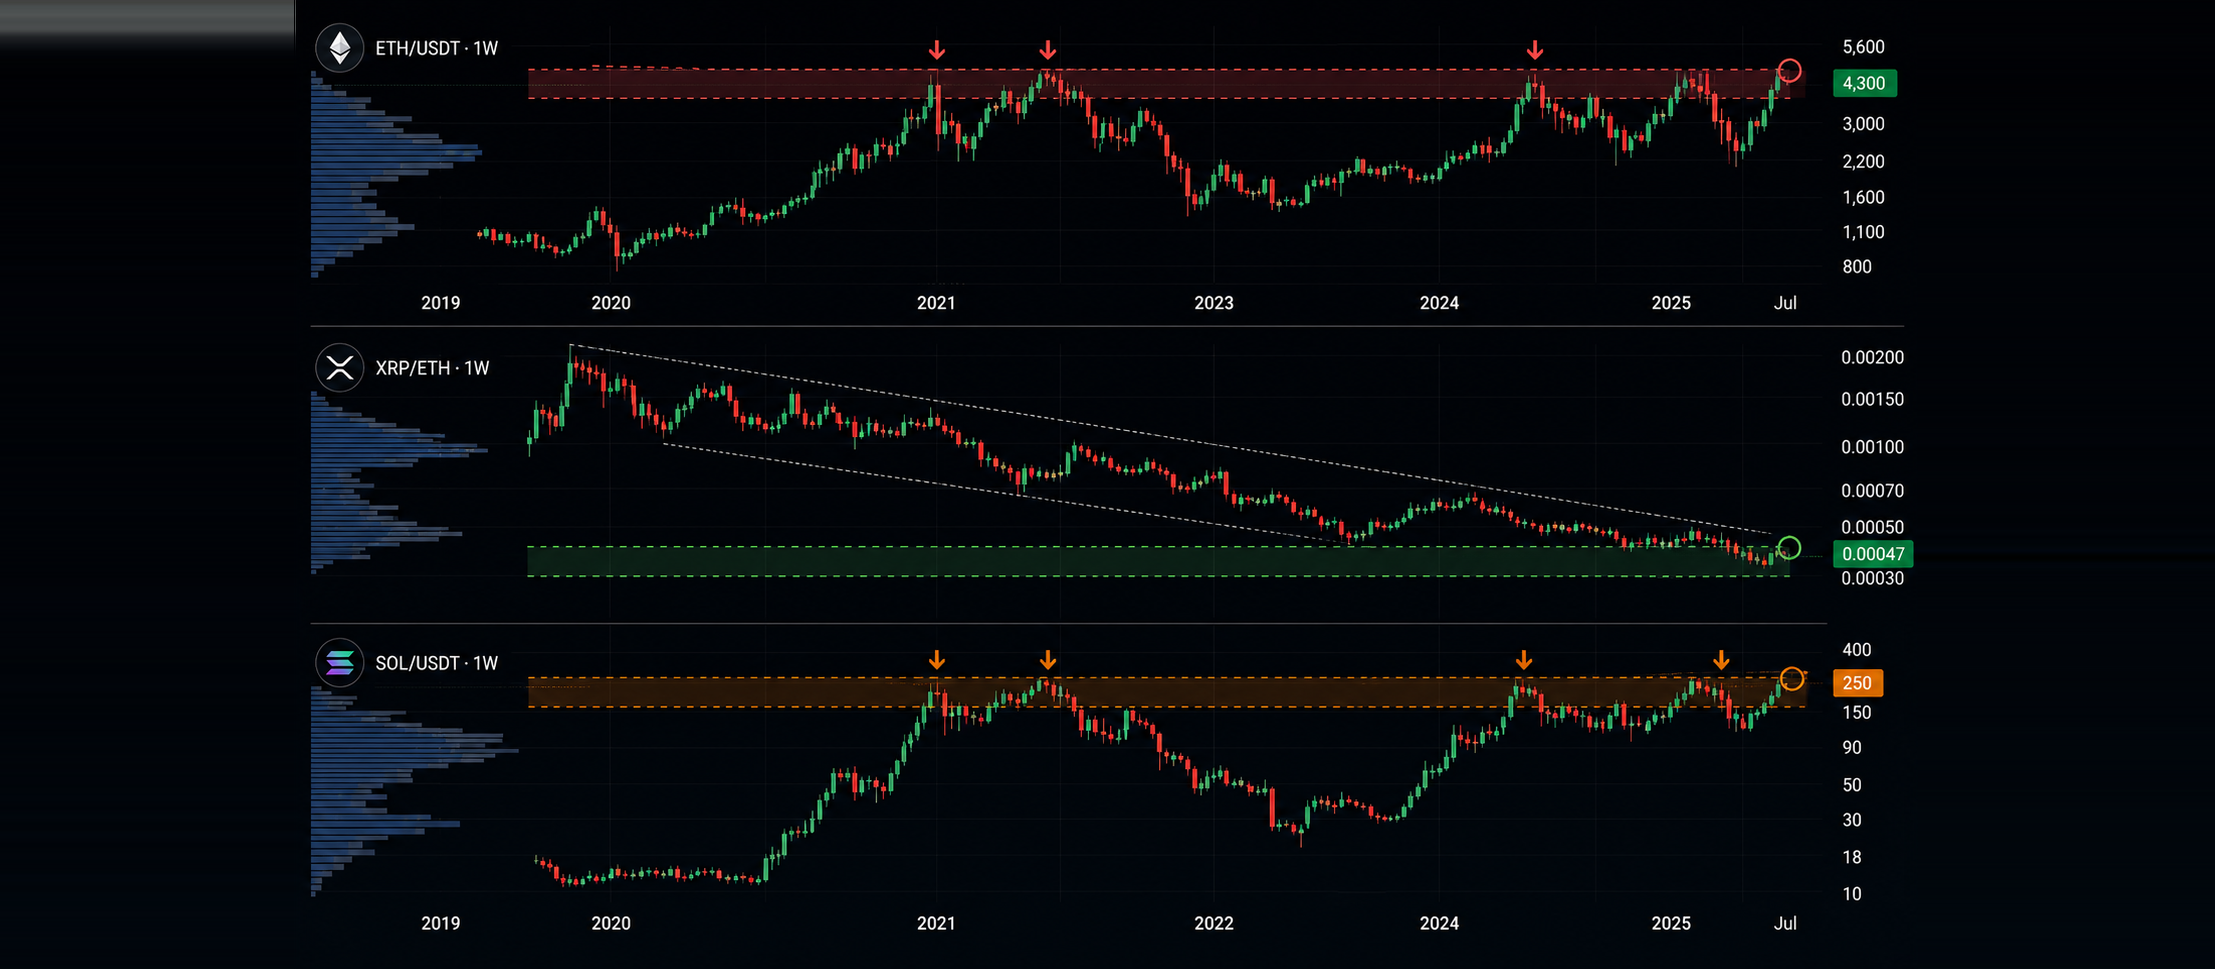
Which Large-Cap Altcoins Are Sitting at Multi-Year Structural Inflection Points
Every few years a large-cap token arrives at an area that has shaped its entire history: a range ceiling that has held through two cycles, a ratio against ether that has never sustainably broken, or a supply band where the majority of coins last changed hands. These are different from ordinary chart levels because they represent accumulated positioning rather than a recent reaction. Identifying them is a research exercise, and it is a genuinely different task from calling what happens next.
What makes structural inflection points different
An ordinary level forms from a few weeks of trading. A structural one forms from years of it. The distinguishing features are duration, participation and repetition. The area has been tested across multiple market regimes, a large share of total volume has traded there, and the reaction to it has been consistent enough to suggest that a meaningful number of holders formed their cost basis at that price. When those three conditions overlap, the level carries information about where supply genuinely sits rather than where a pattern happens to sit.
How to identify them without guessing
Several observable inputs narrow the search. Volume profiles across the full trading history show where the heaviest activity clusters. On-chain cost-basis distributions show the price bands where the largest share of supply last moved, which is the closest thing crypto has to a map of holder pain. Ratio charts against bitcoin and ether reveal whether an asset is at an inflection point in relative terms even when its dollar price looks unremarkable. Long-horizon realised volatility shows whether an asset is compressing into the area or arriving at speed. Comparing these across the large-cap set is straightforward, and the CryptoForecast Hub is a convenient place to run those comparisons.
The categories that currently qualify
Rather than naming a shopping list, it is more useful to describe the categories. The first is the established smart-contract platform that spent years in a wide multi-cycle range and is now trading near the boundary that has repeatedly capped it. The second is the large-cap asset whose ratio against ether has been in a multi-year decline and is testing the lower boundary of that decline, where a change in relative behaviour would matter more than the dollar price. The third is the legacy large cap with a long history of legal or regulatory overhang, where the structural question is whether the discount that overhang created is still justified. Each category has different confirmation criteria, which is why grouping them helps.
What confirmation would look like
An inflection point resolving is not the same as a candle closing beyond a line. Meaningful confirmation usually involves several things at once: sustained volume above the historical average rather than a single spike, a change in the ratio against bitcoin and ether rather than a dollar move driven by the whole market, open interest expanding rather than a squeeze unwinding, and the area holding as support on a retest weeks later. Absent those, the break is a data point rather than a change of regime.
What would invalidate the idea
The framework is wrong in a few identifiable circumstances. If a token's history is short enough that its so-called structural level formed in a single market regime, it is not structural. If the majority of an asset's volume trades on venues whose data is unreliable, the volume profile is fiction. If a move through the area happens entirely because bitcoin moved and the ratio is unchanged, nothing asset-specific has been confirmed. And if supply distribution shows that the coins in the area have already moved, the level no longer represents live positioning.
Becoin.net Tariff Plans ---> Here
Reading this as research, not instruction
This is a monitoring framework. It identifies which assets deserve attention and what evidence would show that something has actually changed. It contains no entries, no targets and no advice to buy or sell any token. Structural points typically take months to resolve, and treating them as immediate opportunities is the most common way the analysis gets misused.

The Best Broker Without Complicated Features (And Why Simplicity Wins)
Most traders don’t fail because they lack knowledge. They fail because their platform buries them in noise before they even place their first trade. Here’s what actually works. It Started With a Confession From a $10 Trader A reader messaged us a few months back. He had been trying to trade for three weeks, had […]

Why Traders Move from Binomo to Deriv in 2026: The Real Reasons Behind the Switch
If you spend enough time around trading communities, you’ll notice a pattern. Many traders start with Binomo. Then, after a few months, a surprising number begin looking at Deriv. Some switch completely. Others keep both accounts but gradually move most of their trading activity to Deriv. I noticed this trend while talking to beginner traders […]

Deriv vs IQ Option for Synthetic Indices: Which Platform Is Better in 2026?
Synthetic indices have become one of the most talked about trading categories among beginners and experienced traders alike. Unlike forex or crypto markets that depend on real world events, synthetic indices operate 24/7 using algorithm driven price movements. That means traders can access opportunities at any time without waiting for market openings or major news […]

Deriv vs Binomo for Low-Risk Trading in 2026: Which Platform Is Better for Safer Growth?
Most beginners enter trading with one simple goal: avoid blowing up their account in the first week. That is exactly why low-risk trading matters more than fast profits. Two platforms that constantly appear in beginner discussions are Deriv and Binomo. Both allow small deposits, short-term trading, and beginner-friendly access. But when your focus is protecting […]

Deriv vs IQ Option for Beginners in 2026: Which Platform Is Better to Start With?
Choosing your first trading platform can decide whether you stay consistent or quit after blowing your first account. Most beginners do not fail because trading is impossible. They fail because they start on platforms that confuse them, encourage emotional trading, or make risk management difficult. Two names that often appear in beginner discussions are Deriv […]

Is Binomo Safe or Risky in 2026? A Practical User Checklist (Not a Generic Review)
I still remember the first time I opened Binomo. It wasn’t excitement. It was hesitation. I had already read multiple reviews. Some said it was safe. Others called it risky. None of them felt like they came from someone who had actually traded, deposited, withdrawn, and dealt with real friction. So I decided to test […]