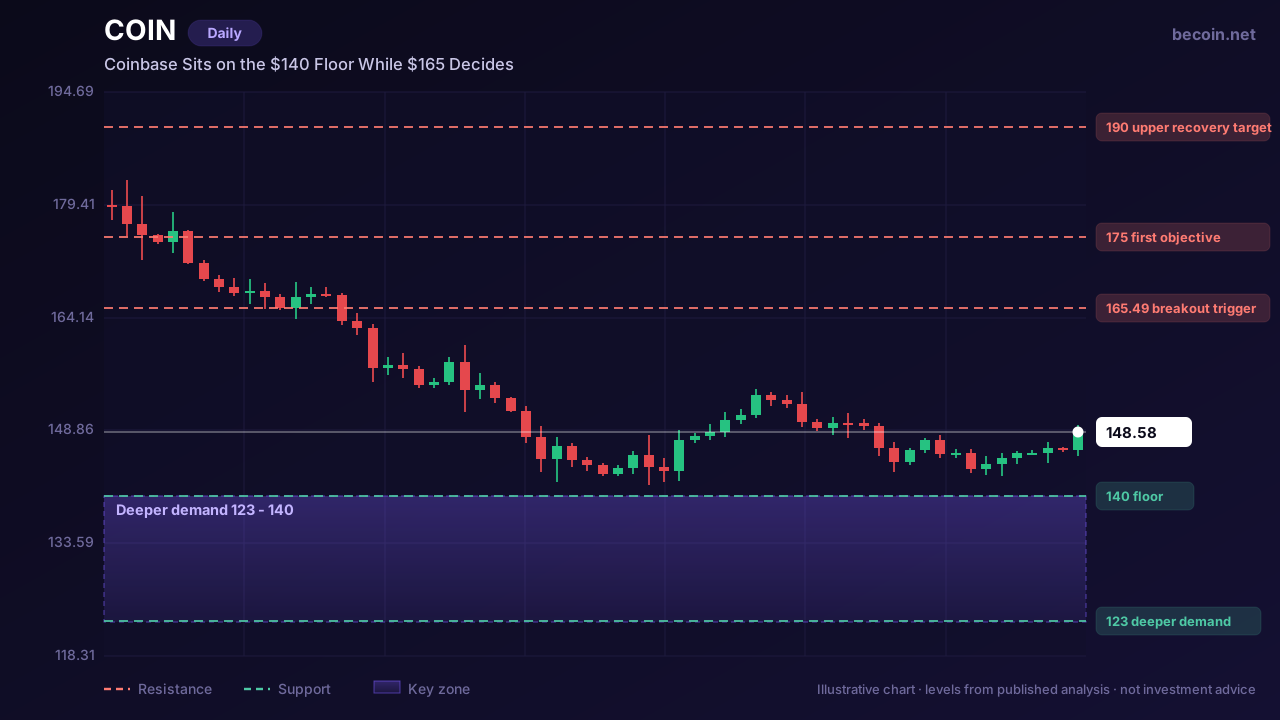
Coinbase Sits on the $140 Floor While $165 Decides the Recovery
Coinbase is trading around $148.58, effectively flat on the day and up slightly on the week, but down roughly 11% on the month, 36% year to date and 54% over twelve months. The all-time high of $444.65 from July 2025 is a distant memory. What the chart shows now is a stock that has stopped going down without yet showing that it wants to go up.
Why the floor is holding
The $140 to $160 area has absorbed everything the market has thrown at it this quarter. Multiple tests, no breakdown, and a visible slowing of downside momentum on each attempt. Several analysts have identified a deeper demand pocket in the $123 to $132 range as the level price would seek if this one fails, which frames the current zone accurately: it is the first line of defence, not the last.
The reason it is holding is not mysterious. COIN's business is leveraged to crypto trading volumes, and volumes have been steady rather than collapsing. The stock has de-rated hard, which means a lot of the bad news is priced. A floor forms when sellers who wanted out are done, and that appears to be roughly where things stand.
The Coinbase number that changes the read
Around $165.49 is the level worth marking. It is the last weekly swing high and the point where the stock would move from consolidating to actually recovering. Below it, every rally is range behaviour. Above it, the structure changes and the stock has cleared the supply that has capped it since the decline began. Our Becoin.net Premium Forecast tracks this name through each of those levels as the tape develops.
That distinction is what separates the two most common mistakes here. One is buying the floor and calling it a bottom — the floor is a place to define risk, not evidence of a turn. The other is waiting for the stock to look good, which on a chart like this means waiting until $190, by which point the asymmetry has gone.
What a recovery would target
If $165.49 is taken on a weekly closing basis, the working objectives are $175 and then the $190 area, both of which correspond to shelves from the decline rather than arbitrary projections. Beyond that, the chart is genuinely open until well into the $200s, but that requires a change in the underlying crypto cycle rather than a technical breakout.
The more ambitious targets circulating — $300 and above — are long-horizon valuation arguments dressed as price levels. They may be right eventually. They are not tradeable from here.
The correlation problem
COIN is not really an independent instrument. It is a high-beta expression of crypto market activity, and its chart will do what the underlying cycle tells it to do regardless of how clean the levels look. Bitcoin has been consolidating in the mid-$60,000s for weeks; if that resolves higher, COIN's $165 level will likely fall without much resistance. If it resolves lower, the $140 floor will be tested in a way that has nothing to do with what Coinbase the business is doing.
That has a practical implication. Traders holding COIN alongside other crypto exposure are usually more concentrated than they think. The stock does not diversify a crypto position — it amplifies it, with equity-market hours and earnings risk layered on top.
Levels that keep you honest
Above: $165.49 is the trigger, $175 and $190 are the objectives. Below: a weekly close under $140 puts the $123 to $132 demand pocket in play, and that is where the more serious buyers have said they are waiting. At $148, the stock is sitting almost exactly between them — which is the least interesting place on the chart, and the place most people feel most compelled to act.
Access levels for the daily level maps, scenario updates and alerts are set out on Becoin.net Tariff Plans.
This is market analysis for educational purposes and is not investment advice. Trading carries risk of loss.

Which Broker Has Faster Withdrawals? Real 2026 Comparison for Traders
When most beginners choose a broker, they focus on bonuses, signals, or flashy interfaces. But after trading for a while, you realize one thing matters more than almost anything else: How fast can you actually withdraw your money? A broker can look perfect until your first withdrawal request gets stuck in “processing” for three days. […]

Which Broker Is Better for Weekend Trading?
It was a chilly Saturday morning, and while the rest of the world was sleeping in or catching up on shows, I was staring at a completely frozen screen. My usual EUR/USD chart looked like a heart monitor flatlining. The traditional markets were closed. The banks were shut down. For a long time, that was […]

Which Broker Is Better for Students in 2026?
For students, trading usually starts with one simple goal: learning how markets work without risking too much money. Most students are not starting with huge budgets. They are trading from a phone, using mobile internet, balancing studies, and trying to avoid losing money quickly. That changes what actually matters in a broker. The “best broker” […]

Deriv vs Binomo for Low-Risk Trading in 2026: Which Platform Is Better for Safer Growth?
Most beginners enter trading with one simple goal: avoid blowing up their account in the first week. That is exactly why low-risk trading matters more than fast profits. Two platforms that constantly appear in beginner discussions are Deriv and Binomo. Both allow small deposits, short-term trading, and beginner-friendly access. But when your focus is protecting […]

Deriv vs IQ Option for Beginners in 2026: Which Platform Is Better to Start With?
Choosing your first trading platform can decide whether you stay consistent or quit after blowing your first account. Most beginners do not fail because trading is impossible. They fail because they start on platforms that confuse them, encourage emotional trading, or make risk management difficult. Two names that often appear in beginner discussions are Deriv […]

Which Is Easier for Beginners: Binomo or IQ Option?
For most beginners, the hardest part of trading is not strategy. It is surviving the first few months without blowing the account from emotional decisions, overtrading, and poor risk management. That is why choosing the right platform matters more than many new traders realize. Two names dominate beginner conversations in binary and short-term trading: Binomo […]