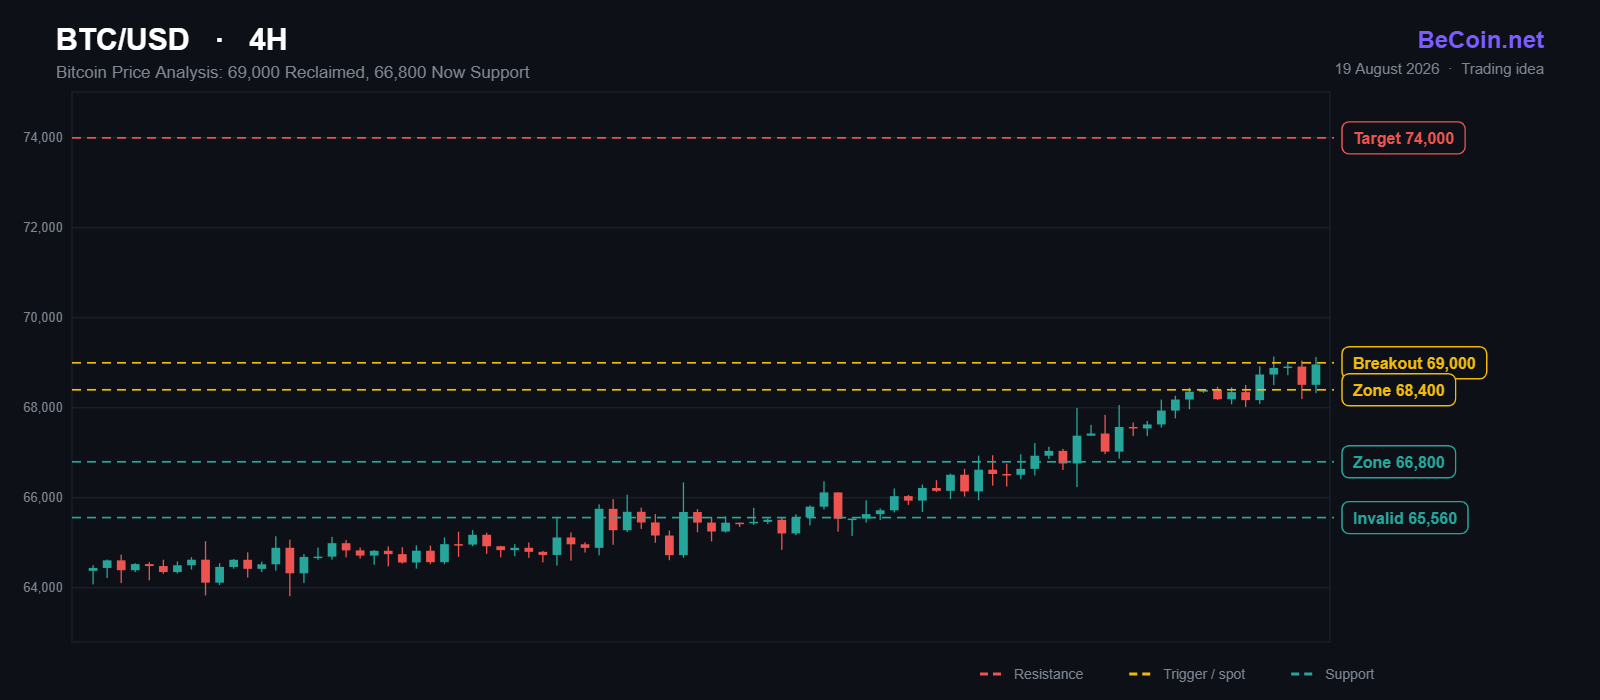
Bitcoin Price Analysis: 69,000 Reclaimed, 66,800 Now Support
Bitcoin did in one session what it had failed to do for two months. BTC climbed roughly 6% over 24 hours to trade above $69,000, its highest level since June, and it did so on a macro headline rather than anything native to crypto. The US Treasury announced it would double the size of its liquidity-support buyback operations in the 10- to 30-year part of the curve, long-end yields fell, the dollar index dropped to 99, and every asset that had been suffering under tight financial conditions caught a bid at once.
Bitcoin price analysis: a liquidation cascade, not just a rally
The move was violent because positioning was wrong. More than $1 billion in crypto positions were liquidated inside a single hour, and roughly $1.6 billion over the full 24 hours. That is the signature of a short squeeze layered on top of a genuine macro repricing, and it matters for how you read the follow-through. Squeeze fuel is finite. Once the forced buying is exhausted, price has to be held by real demand or it gives the level back.
The 66,800 to 68,400 zone is the whole trade
Before this move, 65,560 had been the ceiling that repeatedly rejected price, and the band from 66,800 to 68,400 sat above it as the next area of interest. Both are now beneath the market. The technical question for the rest of the week is simple: does that band flip from resistance into support?
If BTC pulls back into 66,800 to 68,400 and buyers defend it, the structure has genuinely changed and the next objectives sit at $70,000 and then the $74,000 area. If price cuts straight through it and loses 65,560, the entire session gets reclassified as a liquidation spike and the $62,000 to $63,000 support shelf comes back into view.
How to trade the retest
Chasing $69,000 after a 6% candle and a billion dollars of liquidations is the lowest-quality entry available. The patient version is to wait for the first pullback into the flipped zone, look for the daily to hold above 68,400 on a close, and enter with a stop under 65,560. That structure gives roughly $3,000 of risk against a first target near $74,000, which is a workable ratio without needing to predict anything.
Traders who prefer confirmation over anticipation can simply wait for a daily close above $69,500 and treat the first higher low as the entry. Our running BTC level map, including the invalidation points, sits in the Becoin.net Premium Forecast.
What to watch next
Bitcoin was not the leader on the day. Ethereum added nearly 9% and crossed $2,000, Solana gained over 7% to clear $81, and XRP rose 6.7% through the $1 mark. When the majors outperform BTC on a liquidity-driven move, it usually signals that risk appetite rather than a bitcoin-specific narrative is doing the work, and that makes the move more dependent on the rates picture holding.
The main risk is that the buyback programme proves to be a liquidity patch rather than a change in the rate path. If the 30-year yield climbs back above 5.30% and the dollar reclaims 99.38, this rally has no macro leg to stand on. Full desk output and the simulator workspace are covered on the Becoin.net Tariff Plans page.

Bitcoin slips to $65,741 as oil and yields test the breakout
Bitcoin is near $65,741 as rising oil and Treasury yields test the $65.7K breakout floor. Here are the levels that confirm or invalidate the move.

IQ Option vs Deriv Chart Comparison
The Night I Realized My Charts Were Lying to Me It was three in the morning, the exact hour when the market looks either like a goldmine or a psychological hazard. I was sitting in front of two monitors, a lukewarm mug of coffee in hand, watching a critical support level on EUR/USD. On my […]

Best Broker for Learning Price Action in 2026 (Tested by Real Traders)
Most traders think they need a better strategy. What they actually need is a better understanding of price. A few years ago, one of our community members had over ten indicators on his chart. RSI. MACD. Moving averages. Bollinger Bands. Stochastic. Every new YouTube video added another indicator. The result? More confusion. Not more profits. […]

Safest Trading Platforms (Risk Breakdown) – Real Comparison for 2026
Choosing a trading platform isn’t about features — it’s about avoiding hidden risk. Most traders compare brokers like Quotex vs Pocket Option vs Deriv vs Olymp Trade expecting a clear winner. Instead, they find conflicting reviews, promotional claims, and no real explanation of how these platforms behave when money is on the line. The real […]

Binomo Support Contact Guide: What to Send So You Don’t Get Copy-Paste Replies
I didn’t take support seriously until my first withdrawal got stuck. At that point, I had already made a few decent trades and felt confident. But when the money didn’t arrive, I rushed to support and sent a quick message. It felt clear to me, but the reply I received was generic and didn’t solve […]

Deriv Volatility 75 Strategy Backtest: What Actually Works After 1,000 Trades?
The first time I tried trading Volatility 75, I thought I had found the perfect market. No news shocks. No central banks. Just clean, continuous price movement. Within two weeks, I blew my first account. That experience forced me to stop guessing and start testing. Instead of chasing indicators or copying strategies from forums, I […]