Moving Averages: Which Setting Works Best in Binary Options?

When I first started trading binary options, moving averages seemed almost magical. I’d seen charts where a simple line glided smoothly through the chaos, and traders claimed it revealed the trend. I figured that if I just picked the right moving average setting, I could predict the market and win most of my trades. But what looked simple on paper turned into a long process of trial, error, and self-discovery. Over time, I learned that finding which moving average works best in binary options isn’t about copying someone’s formula, it’s about matching the indicator to how the market really moves and how binary expiries behave.
If you want to test moving averages yourself, it’s best to start on a demo account, see how different settings perform without risking real capital. You can open your account via our affiliate link and experiment safely before going live.
My Early Experiments with Moving Averages
The first time I plotted a moving average, I chose the default: a 20-period simple moving average (SMA) on a five-minute chart. My logic was basic. If the price crosses above the line, it’s an uptrend, so I’ll buy a “call.” If it crosses below, I’ll buy a “put.” My expiry time was ten minutes, which felt comfortable, not too short, not too long.
At first, the trades looked promising. The line kept me calm when the price moved erratically. I remember a session where EUR/USD crossed above the SMA, and within a few candles, I was in profit. The simplicity gave me confidence. But by the fifth or sixth trade that day, I realized the pattern wasn’t reliable. Sometimes prices would cross above and instantly fall back. The same setting that worked in one hour failed miserably in another. It wasn’t that the moving average was broken, it was that I was using it without understanding the market condition it was designed for.
So I started keeping notes. Every trade went into a small spreadsheet: the MA type, period, expiry, asset, market mood, and result. It didn’t take long before patterns began to appear.
What I Discovered About Moving Averages in Binary Options
Moving averages smooth out price fluctuations and show trend direction by averaging past data. In binary options, that smoothing is both a blessing and a trap. It filters out noise but also lags behind price. The faster the market, the more delay you’ll face. That’s critical because binary options are time-bound, you don’t just need the direction to be right; it needs to be right at expiry.
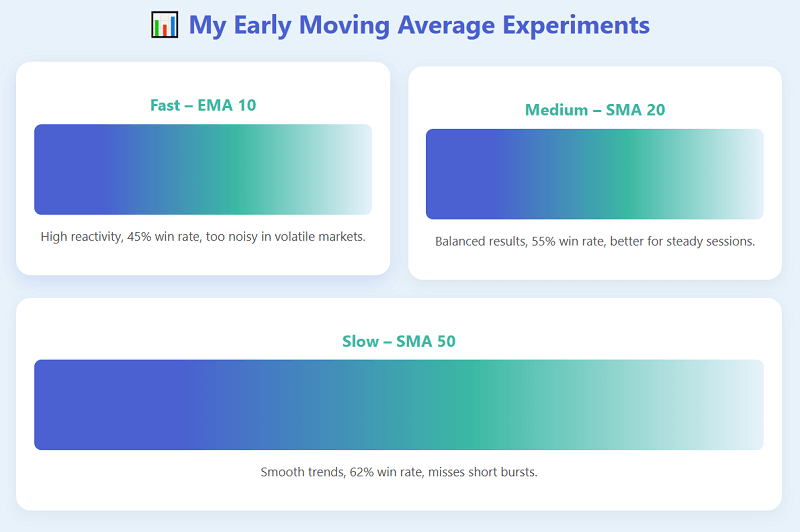
I began comparing shorter moving averages like EMA 10 with slower ones like SMA 50. I noticed that faster ones responded to every small move, which helped in volatile sessions but created a lot of false signals when the market was flat. Slower ones reacted later, but when they did, the signal usually came in strong, confirming a more sustainable move. The challenge was finding balance: a setting that was quick enough to react but slow enough to avoid traps.
Testing Different Settings: My Early Results
I remember one week in particular. I decided to test three setups across my regular trading pairs.
Test 1: SMA 20 on a 5-Minute Chart
Expiry: 10 minutes.
Result: Out of 30 trades, I won 17. That’s about 55%. Decent, but inconsistent. During trending markets, signals worked beautifully. During sideways periods, false crossovers ate away the profits. The lesson was clear, SMA 20 worked only when the market was directional.
Test 2: EMA 10 on a 1-Minute Chart
Expiry: 2 minutes.
This setup was much faster. The EMA caught short bursts of volatility. My win rate dropped below 50%, though, because most signals were just noise. I realized that while the faster EMA gave more opportunities, it also punished hesitation. It required perfect timing and emotional control, something I was still learning.
Test 3: SMA 50 on a 15-Minute Chart
Expiry: 30 minutes.
I slowed everything down. The SMA 50 gave fewer signals but stronger ones. My win rate rose to around 60%, but trade frequency dropped. The long waits between entries tested my patience. Still, it was the first time I felt I was trading with the market rather than chasing it.
That’s when I realized there’s no universal “best” moving average setting. The ideal one depends on your expiry, the market’s behavior, and your comfort with risk.
How I Built My Moving Average Framework
After months of journaling, I noticed patterns between expiry times, market conditions, and moving average responsiveness. I built a small reference framework that became my personal guide.
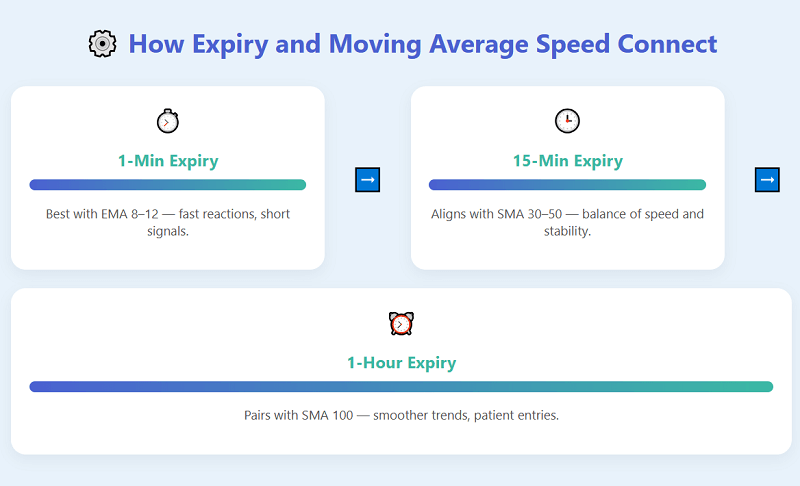
| Binary Expiry | Market Condition | Moving Average Type & Period | Why It Works |
| 1–5 minutes | Strong trending or breakout phase | EMA 8–12 on 1-min chart | Captures short bursts quickly |
| 5–15 minutes | Moderate momentum trend | EMA 10–20 or SMA 20–30 | Filters out minor fluctuations |
| 15–60 minutes | Steady trend with pullbacks | SMA 30–50 on 15-min chart | Allows breathing room for price |
| 1–3 hours | Clear long-term direction | SMA 50–100 on 30-min or 1-hr chart | Best for smooth, lasting trends |
This table helped me match my moving average setting to the expiry I was trading. The one thing most online articles failed to mention was this connection between expiry length and MA responsiveness. Many guides simply said, “Use a 50-period MA,” but never explained that in a 10-minute binary, that line might lag too much to be useful. I wanted to bridge that gap.
How Different Moving Average Types Behaved
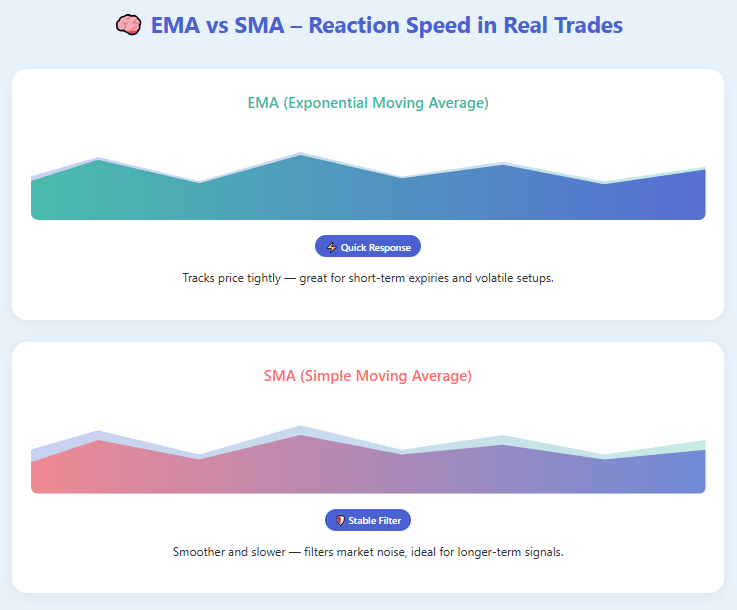
The deeper I went, the more I realized that the type of moving average mattered as much as the period. Simple moving averages (SMA) give equal weight to all past data, while exponential moving averages (EMA) emphasize recent prices. In fast-moving markets, EMA felt like a better fit, it caught breakouts faster. But it also reacted to every little pullback, which caused me to enter too early or exit too soon.
I tested both side by side. In one session, I used a 20-period SMA on one chart and a 20-period EMA on another. The EMA gave me an entry two candles earlier. On strong trends, that advantage made a difference. On false moves, it made me lose faster. That was when I began using both together: EMA for short expiries, SMA for longer ones. It wasn’t about picking one, it was about aligning their reaction speed to the expiry’s needs.
Adapting Moving Averages to Expiry Results
Binary options have a unique structure. You’re not managing a trade dynamically, you’re betting on whether the price will be above or below a level at a specific time. That time constraint made me think differently about moving averages. I stopped looking for perfect entries and started focusing on timing alignment.
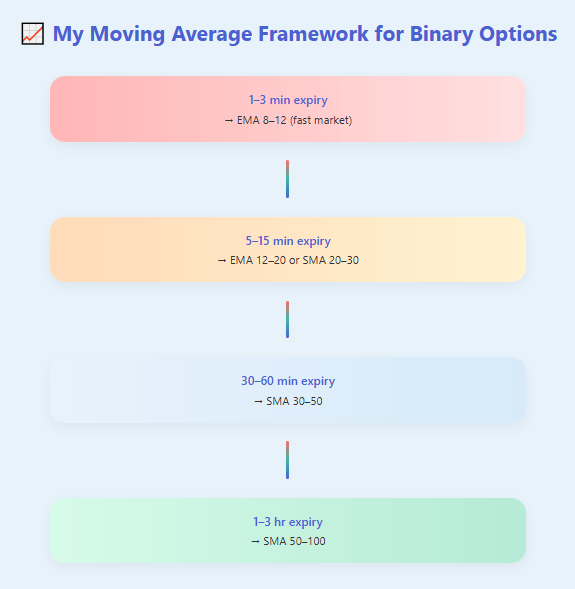
When the expiry was very short, like one to three minutes, I needed a moving average that could react immediately. EMA 8 or EMA 10 worked well in those cases, but only during fast, trending markets. For five- to fifteen-minute expiries, EMA 12–20 or SMA 20–30 gave better balance. They filtered noise without lagging too far behind. For longer expiries, half an hour or more, the slower SMA 30–50 became my go-to, especially on clear trends.
I also started noting payout structures. Shorter expiries offered frequent trades but lower payouts. Longer expiries had higher payout potential but fewer setups. The moving average setting had to complement that trade rhythm. A slower MA might produce fewer trades, but it kept me out of whipsaws that quickly ate up smaller gains.
What I Learned About Market Conditions
One of my biggest early mistakes was using moving averages without considering market type. When the market ranged, even the best setting failed. I’d get multiple false crossovers in both directions. Now, I begin every session by simply asking: is the market trending or ranging? If it’s ranging, I skip trend-based moving average strategies altogether.
I also learned to check the slope of the MA. A flat MA means indecision. A steep slope signals momentum. Price above a rising MA means a strong uptrend, and below a falling MA means a strong downtrend. This simple observation saved me from countless bad trades.
A Trade Example That Changed My Perspective
One trade still stands out. It was a morning session on GBP/USD. I had EMA 12 and EMA 26 plotted on a one-minute chart. The market had been quiet, but then a breakout formed on strong volume. The fast EMA crossed above the slow one, confirming bullish momentum. I entered a “call” binary with a five-minute expiry. The move extended exactly as expected, and the trade finished comfortably in the money.
The very next hour, I tried the same setup in a sideways market. Price wobbled, EMAs tangled, and I took two consecutive losses. That was the day I wrote in my journal: “The right setting only works in the right context.” It sounds obvious now, but in binary options, it’s easy to forget. The market owes you nothing, your job is to pick the moments when the odds align.
Rules That Keep Me Grounded
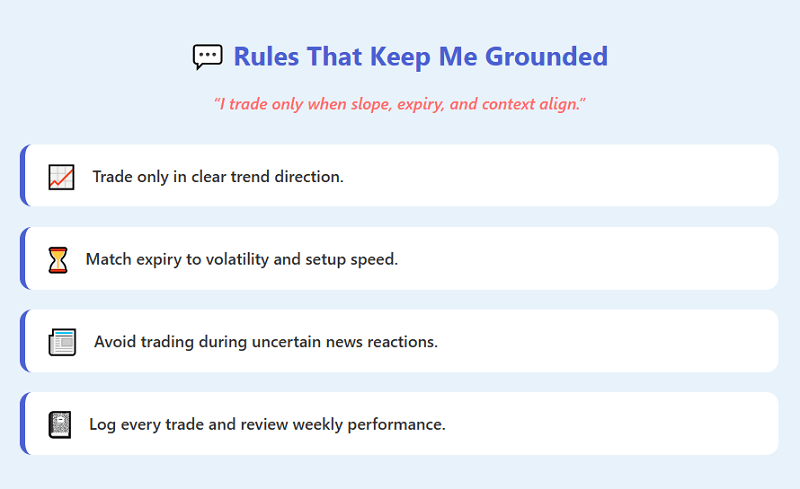
Over time, I simplified my moving average rules. First, I only use trend-based MA setups when the slope is clear. Second, I match MA sensitivity to expiry length, faster averages for shorter expiries, slower ones for longer. Third, I avoid trading during high-impact news releases because volatility can distort MA signals. And finally, I always log trades. That habit of tracking helped me notice which settings worked best in binary options for each asset and time frame.
Instead of relying on generic online formulas, I trust my data. Every week, I review my journal. If a certain EMA starts underperforming, I adjust. If an SMA works better during certain sessions, I note that pattern. Over time, this practice turned a simple indicator into a reliable decision tool.
Mistakes That Taught Me the Most
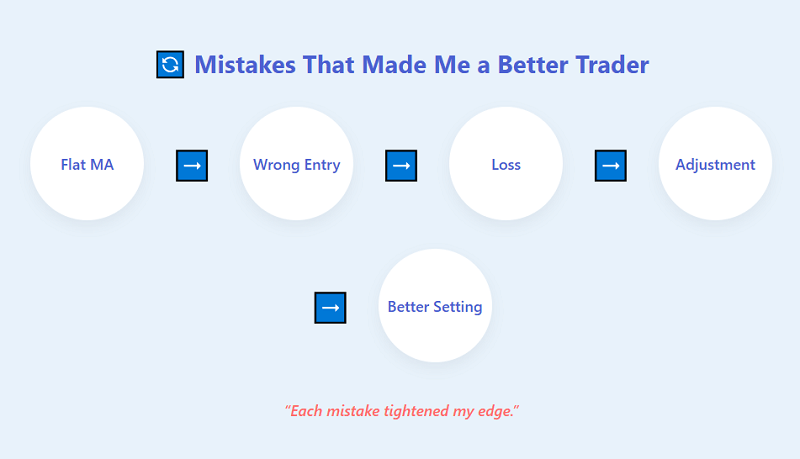
Even after refining my system, I still slipped. One recurring mistake was forcing trades when the MA was flat. I’d convince myself that a reversal was about to start. Most of those trades lost. Another was applying the same setting across all assets. A 12 EMA might work beautifully on EUR/USD but behave differently on gold or indices. I now tweak my MA slightly for volatility differences between assets.
The last big mistake was emotional. After a string of wins with a specific setting, I’d get overconfident and increase volume. Then, when market conditions shifted, I’d lose more than I’d made. Those sessions reminded me that moving averages don’t predict, they react. You can’t control the market; you can only adapt.
My Preferred Settings by Scenario
Here’s how my approach settled after months of refinement:
| Expiry Duration | Chart Time Frame | Preferred MA | Ideal Condition |
| 1–3 minutes | 1-minute chart | EMA 8–12 | Fast, trending markets |
| 5–15 minutes | 5-minute chart | EMA 12–20 or SMA 20–30 | Moderate trends |
| 30–60 minutes | 15-minute chart | SMA 30–50 | Smooth, steady trends |
| 1–3 hours | 30-min or 1-hour chart | SMA 50–100 | Strong, consistent direction |
This table isn’t fixed law, it’s a reflection of what worked for me. Your results might vary, but it gives you a framework to start. The more data you collect, the more you’ll discover your own best combinations.
Why Most Online Guides Miss the Point
As I dug through top-ranked search results, I noticed something missing. Most explain moving averages in general trading terms, not in the context of binary options. They mention common periods, 10, 20, 50, 100, but rarely discuss expiry correlation or reaction lag. They also avoid showing real trade outcomes. Without that, readers never learn how moving averages behave when time is your biggest variable. I wanted to fill that gap with firsthand experience.
My takeaway is simple: the best moving average in binary options isn’t about mathematical precision, it’s about compatibility with expiry, market speed, and your own temperament.
What Works Best for Me
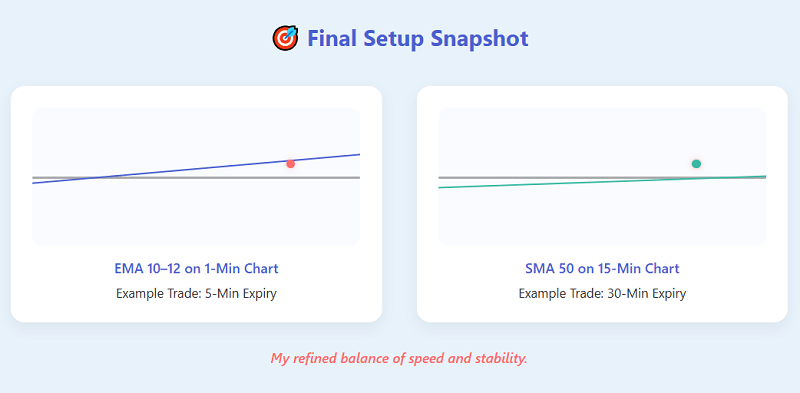
After countless tests, my most reliable setup has been EMA 10–12 on a one-minute chart for five-minute expiries during strong momentum. It’s responsive yet not overly twitchy. For longer trades, the SMA 50 remains my favorite, it filters out noise and keeps me aligned with the broader move. These two together cover most of my strategies now.
But the real shift wasn’t in the setting, it was in my mindset. I stopped searching for a universal “best” and started focusing on adaptability. Each trading day has its rhythm, and my moving average must adjust to it.
If you’d like to experiment with these setups yourself, I recommend testing on a demo before going live. You can open your account through our affiliate link and run side-by-side comparisons with different moving average settings to see what fits your trading pace.
Final Reflection
Moving averages taught me more about discipline than about forecasting. They forced me to slow down, to analyze, to wait for structure. Every crossover, every slope change became a small clue in the puzzle of timing. I still lose trades. But now, I lose for the right reasons because the market changed, not because I used the wrong tool.
For me, the best moving average setting in binary options isn’t a number, it’s a process. It’s the way I align expiry, market phase, and chart rhythm into one decision. The settings evolve, but the approach remains constant: observe, record, refine. That’s what turned moving averages from a confusing line into one of the most reliable parts of my trading routine.
If you’re curious to test how moving averages fit your own strategy, consider trying it in a risk-free environment. You can open a demo account via our affiliate link and start journaling your trades today. The market will teach you faster than any article ever could.
📢 Trade. Journal. Refine.
Start journaling your own MA journey—test it on Pocket Option.
Start Your Demo Journey →