Fibonacci Retracements in Binary Options: Useful or Useless?
I’ve always had a complicated relationship with Fibonacci retracements. The idea that markets somehow respect ratios like 61.8% or 38.2% used to sound mystical to me—like traders trying to make sense of randomness with elegant math. But after years of trading binary options, especially short expiries, I decided to stop reading opinions and start testing them myself.
It began one quiet Wednesday morning. I was staring at EUR/USD on the one-minute chart, watching prices react almost perfectly to the 50% retracement of the previous swing. It wasn’t the first time I’d seen that, but this time I decided to document it. I started tracking every Fibonacci touch, rejection, and breakout for two weeks. What came out of that experiment changed how I view technical tools in binary options forever.
If you’ve ever wondered whether Fibonacci retracements are useful or useless for short-term expiry trades, I’ll share what I actually found—not what textbooks claim.
If you’d like to test Fibonacci tools in real time, open a demo account with our trusted partner platform to experiment safely.
How I Started Testing Fibonacci Retracements
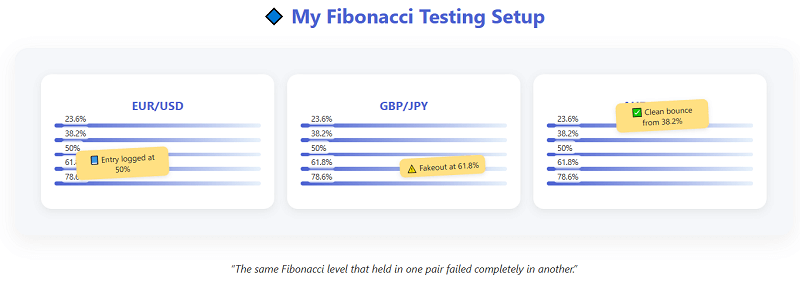
I didn’t want to rely on cherry-picked examples or hindsight bias, so I built a small routine. Each morning, I’d open three pairs, EUR/USD, GBP/JPY, and AUD/USD. I’d mark the most recent clear swing (a visible high and low) and plot Fibonacci levels using the tool in my charting platform. Then, I’d wait.
Whenever the price touched one of the major levels (23.6%, 38.2%, 50%, 61.8%, 78.6%), I logged what happened next. Did the price reverse? Stall? Continue? More importantly, would a 1-minute or 5-minute binary expiry have ended in the money if I had entered at that level?
By the end of the first week, I had 127 Fibonacci-based interactions logged. Some were textbook-perfect reversals. Others were complete chaos. But the pattern that emerged wasn’t random.
The First Discovery: Not All Levels Are Equal
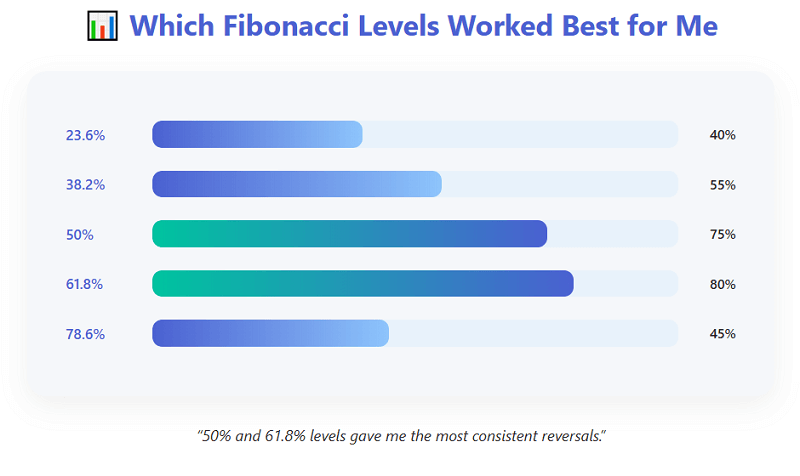
What stood out first was how inconsistent different levels behaved. While 61.8% is often celebrated as “the golden ratio,” my results didn’t always confirm that. In binary options, where timing is everything, the 50% retracement seemed far more reliable for short-term reversals.
Here’s a simplified summary from my first week:
| Fibonacci Level | Reaction Strength (Reversal Probability) | Avg ITM Rate (1-min expiry) |
| 23.6% | Weak / Often Ignored | 42% |
| 38.2% | Moderate / Occasional Bounce | 53% |
| 50% | Strong / Frequent Reversal Zone | 61% |
| 61.8% | Strong / Late Reaction | 58% |
| 78.6% | Overextended / Unreliable | 47% |
I wasn’t expecting the 50% level to outperform the much-hyped 61.8%. But in fast binary markets, momentum doesn’t give traders the luxury of perfect symmetry. The 50% pullback usually represents where traders take quick profits or add new positions before continuation. That hesitation often leads to the kind of short-term reversals binary traders can exploit.
The Timing Element That Changed Everything
However, the Fibonacci level alone didn’t determine success, it was the timing. On several occasions, price respected a Fibonacci level but only after triggering stop runs or small fakeouts. My early entries often failed by a few seconds, which in binary options can make the difference between profit and loss.
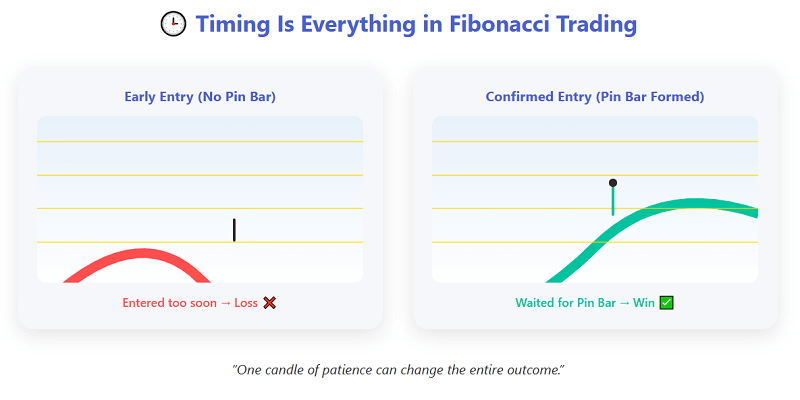
So, I started refining my entry timing. I found that waiting for confirmation candles, especially a small pin bar or engulfing pattern, improved outcomes significantly. My hit rate on the same levels jumped from roughly 54% to 63%. It’s not a magic formula, but it’s enough to turn randomness into controlled probability.
That’s when Fibonacci stopped being an “indicator” for me and became more like a context filter. Instead of trading every retracement level, I began using it to locate areas where the market might hesitate. Then I let price action decide the rest.
You can try marking Fibonacci levels with confirmation candles by signing up for a demo account.
Why Most Traders Misuse Fibonacci Retracements
As I started comparing notes with other traders in forums, one thing became clear: most people use Fibonacci incorrectly in binary options. They expect the market to reverse just because a 61.8% line exists on their chart. But retracements don’t cause reversals—they simply highlight where traders might react.
Common mistakes I noticed included drawing Fibonacci from unclear or overlapping swings, ignoring larger timeframes before marking levels, entering too early without candle confirmation, and using the same expiry regardless of volatility.
In binary options, precision matters more than patience. Even if your level is right, entering one candle too soon or choosing a wrong expiry can ruin the edge. That’s why I began combining Fibonacci retracements with volatility filters, like ATR readings or average candle size. When volatility was high, I extended expiries slightly; when calm, I shortened them. This small adaptation improved consistency more than any setting change could.
My 3-Phase Experiment with Fibonacci in Binary Options
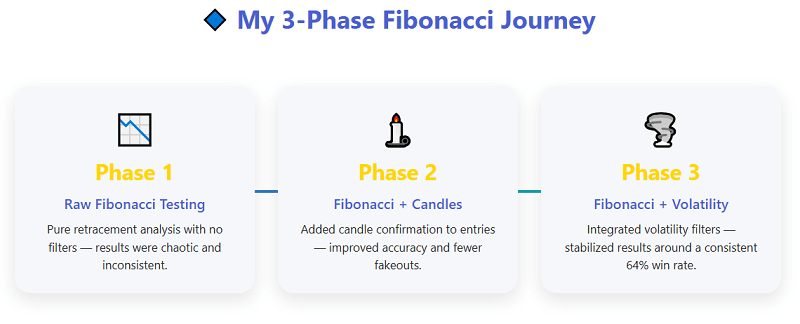
After months of mixed results, I structured my learning into three distinct phases. It made it easier to track progress without emotional bias.
| Phase | Duration | Focus | Key Takeaway |
| 1 | Two weeks | Raw Fibonacci testing on 1-min chart | Highly inconsistent outcomes; timing too early |
| 2 | One month | Fibonacci + candle confirmation | Improved reversals near 50% and 61.8%; fewer fakeouts |
| 3 | Two months | Fibonacci + volatility filter (ATR-based) | Stable win rate (~64%) and smoother expiry timing |
This table might look neat, but it represents hundreds of trades, screenshots, and frustrating near-misses. There were days I questioned if Fibonacci was even worth the trouble. But over time, it began to feel like a language the market occasionally spoke, not a guarantee but a clue.
The Real Utility of Fibonacci Retracements in Binary Options
After all this testing, here’s the most honest answer I can give: Fibonacci retracements are neither universally useful nor entirely useless. They’re a contextual tool. On their own, they don’t predict the price. But when combined with structure, candle behavior, and expiry awareness, they can help anticipate when momentum might fade.
In my trading journal, I now use Fibonacci only for three specific purposes:
- To identify potential pullback zones after strong trends.
- To combine with candle signals before entering short expiries.
- To confirm exhaustion when price has moved too far too fast.
Used this way, it stops being a superstition and becomes a timing aid. And timing, in binary trading, is everything.
Lessons from Losing Trades
Some of my biggest lessons came from trades that went wrong. I remember one on GBP/USD where the price hit the 61.8% retracement perfectly, showed a pin bar, and yet continued higher. I took a “put” with a 5-minute expiry, thinking I had a textbook setup. It expired within two minutes.
When I reviewed the chart, I realized the higher timeframe (15-min) was in a strong uptrend, and I was essentially betting against momentum. Fibonacci didn’t fail; I used it without context. That moment reshaped how I approach it today—I never place Fibonacci without checking the higher timeframe trend first.
The takeaway was simple: Fibonacci levels show where something might happen, not what will happen. Without broader context, they’re just colorful lines.
My Simplified Fibonacci Checklist
For readers who like structure, here’s the distilled version of my approach. It’s not a system, just a habit I built through practice.
- Identify a clear swing high and low (avoid cluttered zones).
- Plot Fibonacci retracement from high to low (or vice versa).
- Mark only 38.2%, 50%, and 61.8% levels.
- Wait for a confirming candle pattern.
- Choose expiry based on volatility, shorter during low volatility, longer when spikes occur.
- Avoid trading against dominant trend direction.
That’s it. It’s deceptively simple, but following this consistently helped me avoid impulse trades and focus on higher-probability setups.
When Fibonacci Fails Completely
There are also times when Fibonacci retracements just stop working, particularly during high-impact news events. I’ve seen prices slice through every level as if they didn’t exist, especially after NFP releases or unexpected rate announcements. In such moments, the market’s emotional reaction overwhelms any technical logic.
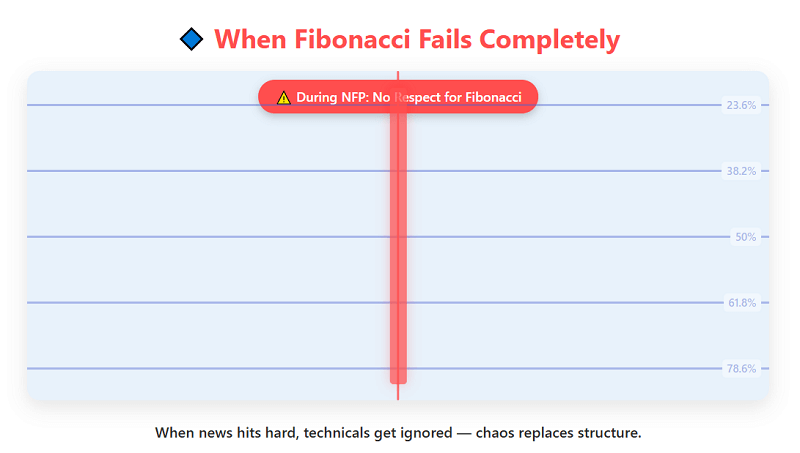
That’s why I never rely solely on Fibonacci for trade decisions during volatile news sessions. I’ve written separately about my approach to trading news in binary options, where I adapt expiry times and reduce size instead of chasing levels.
If you want to explore these setups hands-on, sign up for a free practice account and test Fibonacci strategies safely before risking capital.
Final Thoughts: Useful or Useless?
After all this testing, reflection, and lost trades, my conclusion is balanced. Fibonacci retracements in binary options are useful when treated as context, useless when treated as prediction. They work best as a supporting actor, not the star of your chart.
They remind me to pause before reacting. They visualize what other traders might be thinking, and in short-term markets where psychology moves price faster than fundamentals, that awareness is invaluable. Whether you treat Fibonacci as sacred geometry or just another measuring tool, what matters is how you integrate it into your process.
For me, Fibonacci retracements have earned their place, not as gospel, but as a conversation starter with the market.
📈 Trade. Journal. Refine.
Master Fibonacci trading through observation, testing, and reflection — then put it into action.